

ProfiTrace2 REVIEW - Part 3: Advanced analyser functions

Advanced analyser functions
In this final series of articles on the PROFIBUS analyser, we will, amongst other things, demonstrate connecting the analyser to the PROFIBUS as a Master, the subsequent control of Slaves, setting the network speed (you’ve probably never seen PROFIBUS at 9.6 kbps before) and also the installation and use of plugins that expand this tool’s capabilities. Review by Jaroslav Blažek (blaja.cz).
Reading messages between the Master and other Slave stations on a PROFIBUS line
The ProfiTrace tab, followed by ‘Messages’ at the bottom when using the viewing filter. To view anything, you must start recording messages. This will begin recording all network communication; please remember to stop the recording after a short while, as there is a vast amount of data and it could overload your computer. For subsequent viewing, it is advisable to use the message filter to ensure a clear display.

At the bottom of the window, you can also see the exact content of the message, which is certainly useful, particularly for protocol developers and true enthusiasts.
You can practise using the filter as required; for example, in the image I’ve only shown communication with the station at address 12, where it’s currently stuttering as if at a speech therapist’s. Logically, it’s clear that anything in red is incorrect.

Although the range of options for configuring the recording and viewing filters is truly extensive, the basic presets are entirely sufficient. You won’t miss anything important, whilst the filter will catch out the unimportant details.
This is where you realise that having the programme in Czech is truly invaluable.

The ProfiCaptain tab, where everything relating to the operation of Master functions from a PC is handled. First and foremost, you must set the baud rate to match that used by the Master PLC by clicking on the black ProfiCore box, and then following the highlighted buttons.
Here, we essentially configure everything so that our PC can act as an additional Master on the PROFIBUS network alongside the PLC, ensuring that the PLC programme and the machine’s operation are not affected in any way.

We’ve got everything set up, so let’s switch from Offline mode to Operate mode. In a moment, we’ll have another Master station fully active on the machine.

Obtaining identification data for individual stations
We will now look at the function I mentioned in the first article, namely retrieving the identification data of individual stations. This data is only read when a participant logs into the network; it is therefore not possible to disconnect peripherals whilst the machine is running simply to find out their exact type.
The Class 2 Commands button opens a window where we select the Network scan tab and start the scan. Our PC, acting as the Master, requests and reads identification data from all participating Slave stations. This data is immediately transferred to the Live list in the main ProfiTrace window.
However, there is just one condition for this to work properly. We need to have the relevant GSD files in the correct programme folder for evaluation. There aren’t many included in the installation itself, but the Czech distributor has added hundreds more to the installation CD, so you don’t need to worry. Of course, you can keep adding more and more; I’ve added a few myself, but just don’t forget to rescan the GSD libraries each time.

A brief preview in the main ProfiTrace window of the Live list, where you can see that Slave station types are now displayed instead of addresses. This is an excellent feature when you have multiple stations. Most of them are housed in cabinets and aren’t very easily accessible, so you don’t need to open anything - everything is displayed neatly on its own.

Let’s go back to the ProfiCaptain tab (affectionately known as Captain Korkorán) and connect a single Slave station (an ET200S for demonstration purposes, but I’ve also tried WAGA and others) to our Master - in other words, we’ll essentially ‘borrow’ it from the PLC.
However, as our PC will now act as the Master for the selected station, we will need a GSD file so that we can configure the station correctly for our PC. It will be a little more complicated, but the result is fantastic. The GSD/GSE file must correspond exactly to the specific peripheral; it can easily happen that a GSD file runs in STEP7, but the same one doesn’t work here - which is what happened to me. This mainly concerns differences in the last digits of the product number (-0AB0, etc.)
In the left-hand window, select ET200S from the extensive SIEMENS menu and drag it with the mouse to the right towards ProfiCore.
‘Kapitán Korkorán’ (ProfiCaptain) is the only part of the programme that has not yet been translated into Czech.

Clicking on Slave opens a dialogue box; use the ‘Setup Modules & Parameters’ button to set the actual ET200S configuration, in a similar way to, for example, in STEP7.
Once the configuration has been set up, we can actually try to ‘steal the slave’ using the ‘Steal Slave’ button.

If everything is in order, a green square will appear next to the Slave station and the Slave is ours. The other participants are still under the control of the PLC and the programme in the PLC continues to run.
Using the Watch/Modify I/O button, we can monitor or configure individual inputs and outputs. It’s brilliant: if we don’t want to configure them manually, we can select Bit-Walk mode, for example, and then simply watch as the outputs light up one by one. This is an excellent way to test the functionality of the inputs and outputs without making any changes to the PLC programme. After all, the programme isn’t always available, or it may be password-protected within the PLC.

Testing network stability and response to changes in PROFIBUS speed
Now let’s try completely disconnecting the PLC from the PROFIBUS network, and all data for the Slave stations will be generated on our PC. In practice, we will disconnect the connector on the PLC, but connect our Master from the top. This allows us to thoroughly test the quality of the line and its ability to operate - or fail to operate - at high speeds.
First, however, we must switch the Master to offline mode; otherwise the PROFIBUS speed will not change. This is important and easy to overlook: the setting may look correct on screen even though the speed has not changed.
In the parameter settings, we’ll select the PROFIBUS speed - we’re going for the maximum. We’re not ones to do things by halves; let’s see what happens.
We will confirm everything and switch back to the fully active Master, i.e. Operate mode.

Now let’s go back to the ProfiTrace tab and try to detect the speed automatically. After a moment, the settings will appear in the drop-down menu on the right. There’s nothing to configure here; if our speed isn’t confirmed, something’s wrong and we need to go back to the previous step. It’s quite confusing the first time round, so once you’ve tried it a few times, it’ll become clear.

The most interesting part is in the Oscilloscope tab, where we can see the actual signal waveforms on the bus. It is clear that the waveform at 12 Mbps is heavily distorted, but we already demonstrated this in the previous section.
I measured the time between two edges in the station’s response using the cursors; this is the value marked in yellow in nanoseconds. It will be interesting to compare this at lower speeds. Do give it a go: set different speeds and analyse the waveforms.

Now the oscilloscope really shows the difference. It is the same message as at 12 Mbps, but at a speed of 9.6 kbps. The distance between the pulse edges is again shown in yellow, but the time readout is now in microseconds rather than nanoseconds.
Although this is an extreme case, it is interesting to note that the highest speed is not actually all that advantageous, as it places high demands on cabling, implementation and support from Slave stations. Therefore, the most common 1.5 Mbps is entirely sufficient for many applications. I would go so far as to say that even 500 kbps or even 187.5 kbps would be sufficient, and, more importantly, more resistant to interference and poor cabling.
Even at a speed of 9.6 kbps, it is not worth underestimating the importance of correct cabling and bus termination.

What the ProfiGraph plugin can do
This was originally supposed to be the end, but just before finishing the article I received a plugin with the ProfiGraph software, which utilises the ProfiTrace 2 driver and connects a tool to the PLC for graphical recording of variables with a precision of one PLC cycle.
A separate installer will run, which will install the relevant software on your PC. It’s not complicated, but the manufacturer apologised to me for an error in the installer, which stubbornly suggests an incorrect installation path for the old programme. Therefore, set your own path - somewhere within the PROFIBUS tester ProfiTrace 2 directory - and create a folder there, for example, called ‘Tmp’.

A new tool will also be created in the programme’s menu, and, most importantly, a manual with examples where everything is described in such detail that I was quite surprised. Virtually anyone should be able to get it up and running.

Now it gets a bit more complicated. The plugin itself is nothing more than a dll library, named plg_název.dll. This file, plg_profigraph_profilogger.dll, can be found in the folder where ProfiGraph was installed, and we copy it to the ProfiTrace 2 programme directory, specifically into the app and plugins folders.
After launching ProfiTrace, go to the Settings and Plugins menu to check whether the plugin has loaded. If not, there is a button for this; if so, enable the plugin.
And now for the most important part. Use the ‘General Settings’ button to check whether the plugin has started the TCP server! This is important, as it will be used for communication with ProfiGraph. It didn’t start for me, as the plugin was only a demo - what a pity.
Although the manufacturer offered me two for the price of one - a promotion straight out of a leaflet - it was still quite a lot of money just for a trial. That said, similar tools are sold separately for many times the price, so the plugin is definitely worth it!

ProfiGraph running. In the demo version, it will only allow you to load previously saved waveforms for demonstration purposes.
TCP Setting is used to configure the connection to ProfiTrace 2. Replace Localhost with the IP address of the computer on the network if ProfiGraph is running on a different PC to the one running the analyser itself. If everything is on the same PC, there is no need to change anything.
Exporting measured data to Excel is a given.
Although these supplementary tools may not always look particularly impressive graphically, they are capable of so much that their appearance is entirely irrelevant; the data is what matters most. And that is what this is all about.

ProfiTrace: an investment in the future
One could go on and on, but that is not the purpose of this article. This series is more than enough to introduce you to ProfiTrace2. Even so, there’s been plenty covered. FOXON offers it on loan, or can demonstrate it for you on your premises. It really is worth seeing.
Just last week, a customer told me that their client is now starting to require a report on the status and interference on the PROFIBUS network when a machine is handed over. So they simply reached into the cabinet, took the measurements, and that was that. And the same will apply the other way round. Fortune favours the prepared.
Think of it as a suggestion for a Christmas present, or perhaps an investment to reduce your tax liability before the end of the year.
Part 1 of the review: ProfiTrace2 REVIEW - Part 1: What does a PROFIBUS network really look like? An analyser can help you
Part 2 of the review: REVIEW OF ProfiTrace2 - Part 2: The Most Common PROFIBUS Faults
Recommended products2
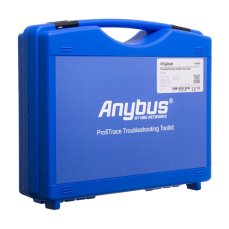
ProfiTrace 2 Ultra Pro – PROFIBUS DP/PA tester
5 944,73 EUR Incl. VAT

ProfiTrace 2 Ultra Plus – PROFIBUS DP Tester
4 399,56 EUR Incl. VAT