

ProfiTrace2 REVIEW - Part 2: The Most Common PROFIBUS Faults

The most common PROFIBUS faults
The next instalment on the ProfiTrace2 analyser for PROFIBUS networks, in which we’ll demonstrate what the most common faults look like and how and where they are displayed using the analyser. Now the interesting bit really begins. To round things off, I’ve also got some videos for you where you’ll see exactly how the signal changes, for example, during a short circuit on the line and so on. This review of the analyser was prepared by the renowned engineer Jaroslav Blažek (blaja.cz).

We explained the individual tabs containing the ProfiTrace 2 tools in the first part, so we can get straight to the point. The basic tests were carried out at a speed of 1.5 Mbps; screenshots from the application running at 12 Mbps are included for comparison.
Display of PROFIBUS signals and faults
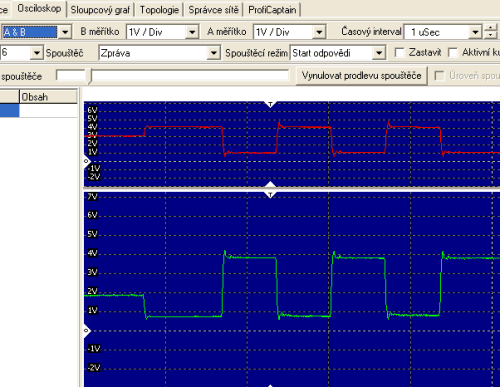
Just to remind you, this is what an ideal signal on a PROFIBUS bus looks like. This image shows both channels and will be useful for comparing short circuits on bus A or B.
However, before we get straight to faults on the PROFIBUS network, we will also look at Slave configuration faults.
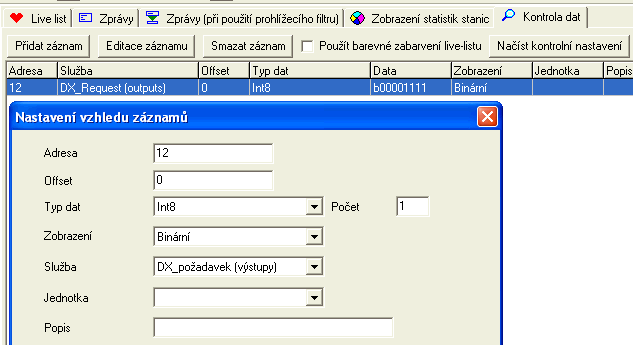
The ProfiTrace tab, and then Data Monitoring at the bottom - that’s the tab with the magnifying glass. Here we can see the data being written to or read from the selected station. Using the ‘Add Record’ button, we can specify in a separate window what we want to view. In this example, it is an ET200S peripheral fitted with a 4xDO module, and from the PLC programme, all 4 outputs are flashing at 1 Hz.
If you think this is nothing special, note that you do not need to know the peripheral space address (PIW/PQW) anywhere. You only need to enter the PROFIBUS address. This function reads all the data from the Slave. This can be seen in the ‘Data’ column, where the first four bits are set to ‘H’ in binary form, indicating a request to switch all outputs on.
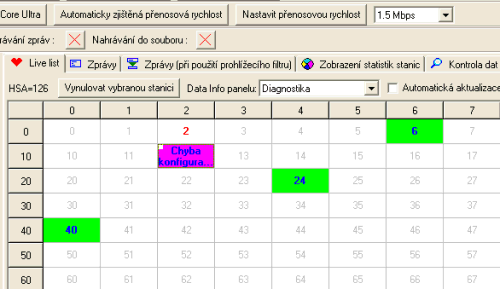
Still the ProfiTrace tab, and at the bottom the Live list - that’s the tab with the heart icon. Now we’ll see a fault on the Slave station, specifically a configuration fault. Specifically, whilst the system was running, I removed the aforementioned 4xDO module from the ET200S. This isn’t because I have a particular preference for the ET200S in simulation, but simply for the sake of ease; modules are more difficult to remove from Wago stations.
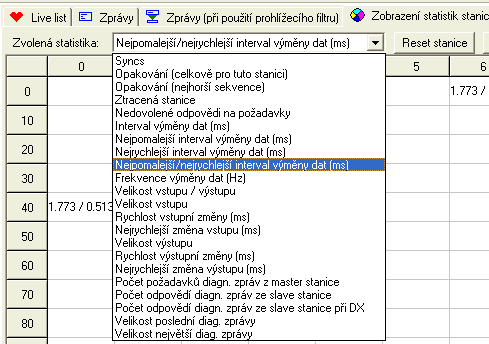
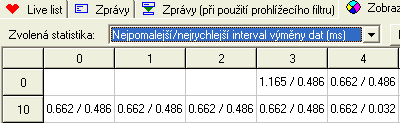
We are still on the ProfiTrace tab, but this time we have the Station Statistics view. A very important function. The drop-down menu shows all available station statistics. ProfiTrace 2 begins recording these immediately upon launch, so that they are available to the user at any time. These are primarily the first five fault statistics. The others are more of an informative nature; specifically, you can see here the data exchange intervals at address 40 (1.776 ms and 0.513 ms). The PROFIBUS speed here is still 1.5 Mbps.
For higher PROFIBUS speeds, the exchange interval is not proportionally faster; the image below, shown for comparison, is from an actual application running at 12 Mbps.
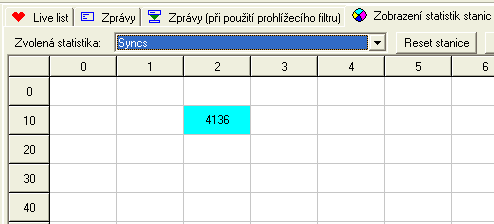
Right, here’s a nice example of how the Syncs fault statistics are increasing at address 12 (Syncs - this refers to the exchange of control data between the Master and the Slave; put simply, the Master keeps asking the Slave, ‘Are you there?’, and the Slave replies, ‘Yes, I am’).
I would like to point out here that even though Syncs occasionally increase in these statistics, everything may still appear to be OK on the surface. However, this indicates potential problems which may worsen and cause more extensive communication failures, manifesting themselves, for example, in the machine shutting down.
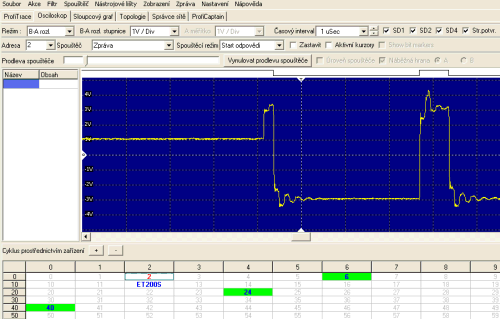
The Oscilloscope tab and one of the common faults. At the last station with address 12, the network terminating resistor is faulty or not switched on. This is indicated by the slow rise time of the waveforms.
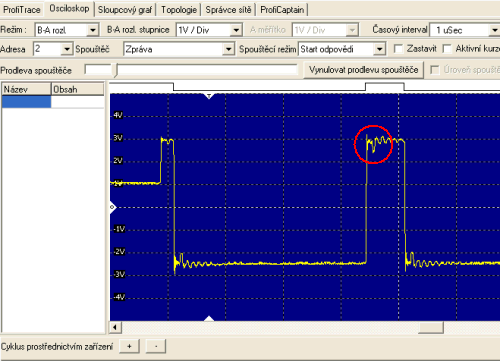
The Oscilloscope tab and, once again, a fairly common error. Somewhere on the line there is a spur line, typically a coiled section of PROFIBUS cable in the programmer’s control cabinet, with one end connected via a connector to the Slave station. That is the dip circled in the waveform.
By studying the waveform and the manual in more detail, you can use the signal response time to determine how far the spur line is from the measurement point.
The ‘Oscilloscope’ tab and, once again, a fairly common error: SHORT CIRCUIT. Nothing out of the ordinary, and unless it is directly at the connector, the PROFIBUS can sometimes still function despite this, especially if only one branch is short-circuited - mainly B, i.e. the red one. This, however, is a short circuit on A, i.e. the green branch, and that is fatal.
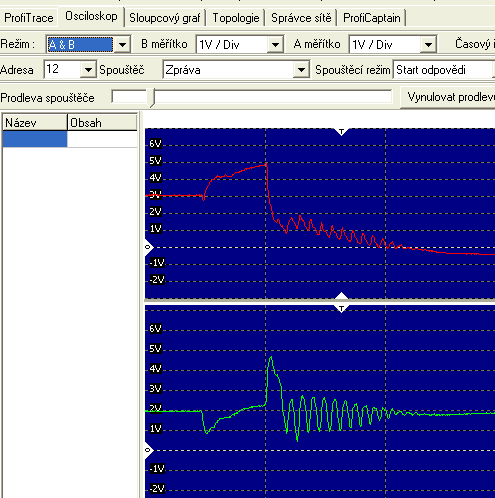
The ‘Bar Chart’ tab shows that a short circuit on the bus is now unsustainable, with a significant voltage drop on both the Slaves and the Master. Station 6 is a Wago unit on which the short circuit occurred via an approximately 10-metre PROFIBUS cable.
It struck me that devices from different manufacturers on the PROFIBUS bus have varying sensitivity to signal processing. Whilst the ET200S would crash at the slightest hiccup, the WAGO 750-323 kept going right up to the very end, even with highly distorted waveforms. However, this is merely an observation, not supported by objective laboratory measurements.
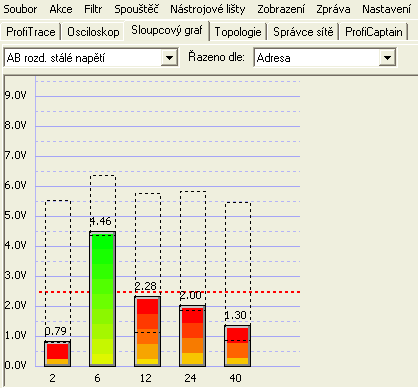
The ProfiTrace tab and the short circuit mentioned above as they appear in the Live list panel. Wago, however, is still going strong.
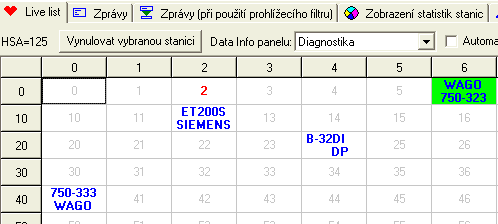
The Oscilloscope tab and a very common fault. It’s interference. However, I was unable to reproduce this using any standard methods; I tried a hairdryer, a blender, a drill, plus all manner of domestic appliances connected to a stripped PROFIBUS cable - unshielded and wrapped in a power cable - but nothing happened. It’s a shame I don’t have a hairdryer like Mr Kopecký in a certain comedy film, where he removed the capacitor from it and used it to jam his neighbours’ TV. If anyone had come round to our place at that moment, they’d probably have thought I was completely mad. The robustness of the PROFIBUS was remarkable. The image is therefore from a real-world application, borrowed from a colleague.
Interference is circled and manifests itself mainly as dips in the empty part of the telegram, where current flows only through the terminating resistors and the voltage level is approximately 1 V. This is a very dangerous fault and is difficult to locate.
To generate the final report, use the Report -> Generate Report menu. You can choose everything imaginable - and even the unimaginable - to include in the report; however, the company name must not be omitted from the header, as the report will not be generated without a completed header.
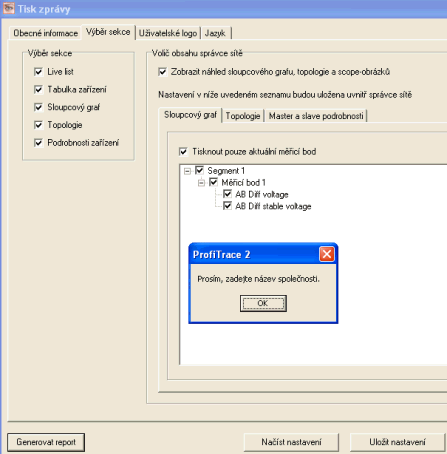
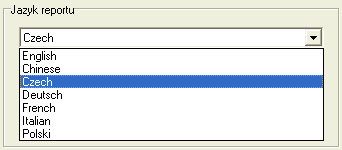
In addition, you can insert your logo into the report and, if the report is for a foreign partner, select a language version from a range of languages - not just the standard German and English.
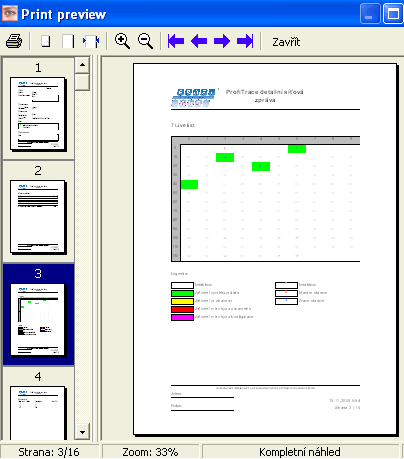
Press the button to generate everything and view it in the preview. Then simply print it out - preferably directly to PDF - and submit it.
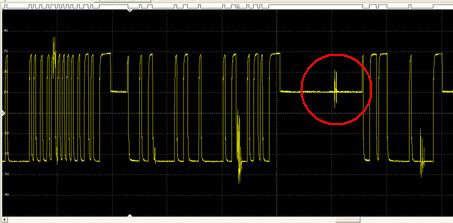
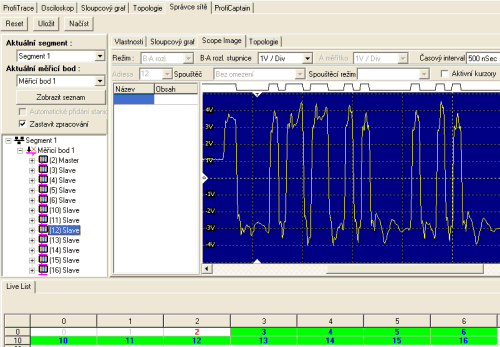
Finally, here is an example showing that things are not always straightforward. The waveforms seen so far, including the video demonstrations, come from a PROFIBUS network running at 1.5 Mbps. This waveform, however, comes from a network running at 12 Mbps. At this speed, the waveform is far from ideal and interpreting it is more complicated.
Take a look at some video demonstrations of the most common faults, where changes in the signal waveform are clearly visible.
A faulty or unconnected terminating resistor at the end of the PROFIBUS bus:
PROFIBUS dead-end branch:
PROFIBUS bus short circuit:
What we have covered so far and what lies ahead
There are countless types of faults and their patterns; I have endeavoured to at least outline the most problematic ones. Saved data can be loaded into the analyser and viewed without a connection to the bus. In the final section, we shall explore the analyser’s more advanced functions, such as message content, simulation of an entire PROFIBUS network and, for example, taking control of a Slave station.
Part 1 of the review: ProfiTrace2 REVIEW - Part 1: What does a PROFIBUS network really look like? An analyser can help you
Part 3 of the review: ProfiTrace2 REVIEW - Part 3: Advanced analyser functions
Recommended products2

ProfiTrace 2 Ultra Pro – PROFIBUS DP/PA tester
5 944,73 EUR Incl. VAT
ProfiTrace 2 Ultra Plus – PROFIBUS DP Tester
4 399,56 EUR Incl. VAT