

ProfiTrace2 REVIEW - Part 1: What does a PROFIBUS network really look like? An analyser can help you

Installation and initial measurements
PROFIBUS - a robust communication network found in thousands of industrial devices. It has been in use for years and continues to play an important role in automation. But what if a problem arises? Is it really enough to watch the green lights on the peripherals and trust that everything is fine? Unfortunately, no.
This is precisely why tools exist that help you look ‘under the bonnet’ of the network. One such tool is the ProfiTrace2 analyser from Anybus, which is part of the HMS Networks group. Thanks to it, you can not only diagnose faults but also understand what is actually happening on the network. And because this tool is capable of so much, we have prepared a three-part series of reviews for you in collaboration with the renowned technician Jaroslav Blažek (blaja.cz). We will also be accompanying some of the instalments with short videos.
What can you expect in the first instalment?
In the introduction, we will look at the tool itself - its installation, connection to the network and working with its software environment. In the second part, we will look at typical faults in PROFIBUS networks and how they manifest themselves. Finally, we will demonstrate how ProfiTrace2 can be used to simulate a Master station, configure network parameters and utilise software extensions.
A quick introduction to the hardware and software
The analyser consists of two parts - the ProfiCore converter, which you connect via USB, and the ProfiTrace2 programme. The software is fully localised into Czech, including the help section, which makes it much easier for less experienced users to work with.
The software licence is hardware-bound. No Siemens software is required - the analyser uses its own driver. It works without any issues on Windows 10 and 11 operating systems.
Power is supplied directly via USB; the pack also includes a booster cable for situations where connection stability needs to be improved. There is also the option to connect an external power supply.

Installing ProfiTrace2
This is the hardware component: the ProfiCore converter, about the size of a long cigarette packet, with an MPI port and a USB input. The USB cable is a standard one costing just a few crowns; the MPI connection is on a 9-pin cannon connector. The ProfiCore converter is powered via USB, so you don’t need a power supply! In case your laptop cannot provide sufficient power, the pack includes an additional USB cable to boost the power supply. You can also use the input for a separate external power supply.

In addition to tests and measurements on a real industrial network, where you will gain the necessary practical experience, this test setup is invaluable for various reconfigurations, simulations and similar attempts to create as many faults as possible.
First, however, everything must be installed correctly and in the specified order.

Fortunately, the installer takes care of everything necessary in a separate window. Everything is pre-configured so that the user has to intervene in the installation as little as possible.

First, install the driver for the ProfiCore converter. It’s simple; the whole process takes just a few minutes.

Once the driver has been successfully installed, the installer will automatically proceed to install the software. All you need to do is specify the path where you want ProfiTrace2 to be installed. It will all be done in about 10 minutes.

When connecting the ProfiCore converter to a USB port for the first time, Windows will detect new hardware. Confirm the windows displaying the newly detected hardware and wait for the software installation to complete.

Launching the software
Now everything is correctly installed and ready for use. The software itself takes up around 140 MB of disk space, which is minimal considering what it can do.
However, before we launch the software, we will copy the licence file to the app folder and all GSD files from the accompanying CD to the GSD folder.
The software runs in a single window using a tabbed system; from left to right: ProfiTrace - Oscilloscope - Bar Chart - Topology - Network Manager - ProfiCaptain, providing quick access to the programme’s key functions.
First, however, select ‘Czech’ as the language via the Settings menu, and then select the ‘Scan GSD Libraries’ function. This is important for identifying all devices on the line, as the tool compares a device’s identification with the header of the GSD files when it logs in and assigns the correct name to the Slave. It’s excellent for visualising the network in the Live List.
Scanning the GSDs takes a little while, as there are so many of them. There’s nothing to stop you from adding more; I had to add a few myself, mainly because of the simulation master functions (ProfiCaptain), which will be described in more detail in a future article, as they are not exactly straightforward.

Before we attempt to connect to the network after scanning the libraries, I would like to point out that via the File menu etc., we can save each measurement, back it up to an archive, or easily transfer it to another computer to examine it in detail offline, print it out and compile a report. Or send it to a colleague for consultation.
ProfiTrace tool tabs
In order to see anything online at all, we must first connect the ProfiCore Ultra (using the greyed-out button on the left). In the image, it is already connected and can only be disconnected. This should always be done before closing the software.
The application offers an intuitive interface divided into several sections:
- Live list (ProfiTrace) - a continuous overview of active bus participants, including addresses and statuses.
- Oscilloscope - displays the signal waveform at individual stations. Cursors can be used to measure voltage and time parameters precisely.
- Bar chart - shows the signal voltage levels. The colour coding indicates whether the signal is of good quality.
- Topology - automatic calculation of device layout within the network. If the cabling is faulty or the termination is incorrect, the system will alert you.
- Network Manager - provides a summary of all measurements and allows them to be viewed even without a connection.
- ProfiCaptain - enables the simulation of a Master station from a computer and the independent control of peripherals.
The ProfiTrace tab, the main tab, and at the bottom of it the so-called Live list (with a heart icon), which constantly displays all devices on the line. All four devices are OK here. To avoid confusion, you will normally only see PROFIBUS addresses in the green boxes. To see the names as well, you must use the ProfiCaptain master function or disconnect and reconnect the peripheral to the network. Why? Only after connecting the peripheral to the network will the Master-Slave communication include a header with the peripheral’s name, as mentioned above.

The ‘Oscilloscope’ tab is, once again, very important. Here, we can view the signal waveform at individual stations. We can see the signal not only on the Master but also on a selected peripheral device, thereby showing how the signal propagates, where it breaks down, and so on. We can trigger (synchronise) messages from all options; when enabled, the cursors accurately measure the signal’s time and voltage values.
You can see roughly how wide the pulse is (hundreds of nanoseconds).
The signal waveform here is essentially ideal, just as it should be. Measured at station address 2, i.e. on the Master. However, it can very quickly go haywire, leaving some stations unsure of what to do. The worst part is the occasional dropouts, which are also clearly visible, although a different tab for detailed reports between the Master and Slave is used to identify them.

The ‘Bar Chart’ tab - this probably requires no further explanation. The online chart displays the signal voltage levels at individual stations. The levels are colour-coded according to signal quality and usability.
Please disregard the station with address 1 for now; it is there due to the use of ProfiCaptain’s Master functions, which will be discussed in a special instalment.

Topology tab: before you see the diagram of your network’s topology, please pay attention to the red lines. The topology is not always calculated correctly, mainly due to poor-quality networks. Experience shows that there are plenty of poor-quality PROFIBUS networks. If we are certain, we can click the ‘Calculate Topology’ button.

There you go! Of course, the tool calculated the topology without any errors here - why wouldn’t it? You can trust the calculated distances; I’ve verified them myself.

The Network Manager tab provides a summary of all important measurements on the network. Unlike the Oscilloscope tab, this data is also accessible offline, i.e. even when viewing a measurement file.
You will rarely see a signal waveform like this on a Slave station with address 6; it is, in fact, the ideal scenario of how it should look, which is not usually the case.

The ProfiCaptain tab: more advanced analyser functions. From your PC, it can, for example, simulate a Master on the network, assign peripherals to it and control them independently of the PLC programme.
This is the only part of the entire tool that is not fully localised into Czech.

PROFIBUS signal example
To conclude the article, I have prepared a short video demonstration with a little puzzle, so that you can see what a PROFIBUS signal looks like when its state changes online:
What we’ve seen so far and what lies ahead in future instalments
In the first part, we therefore clarified the analyser’s basic capabilities, showing how, with just a few mouse clicks, you can access the information you need about the network and quickly pinpoint the source of potential problems. I would like to point out, however, that no tool can determine the location and type of a fault on its own; it is always up to a person to assess the measured data. Just like an oscilloscope and a mains sine wave, which show good and bad waveforms, but it is up to a person to determine which is which.
In the next article, we’ll show how the analyser displays common faults on a PROFIBUS network, try to generate some interference and learn about generating reports. I’ll provide some reports for you to download so that you can get an idea of just how much information can be gleaned about a PROFIBUS network.
And in the final section, we’ll take a look at the analyser’s more advanced features.
Recommended products2
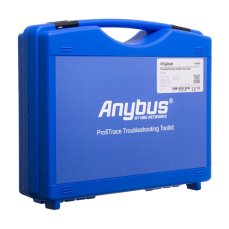
ProfiTrace 2 Ultra Pro – PROFIBUS DP/PA tester
5 944,73 EUR Incl. VAT

ProfiTrace 2 Ultra Plus – PROFIBUS DP Tester
4 399,56 EUR Incl. VAT