

PROFIBUS diagnostics with ProfiTrace 2 - practical guide
From connecting the tester for the first time to troubleshooting reflections, interference and occasional outages. Learn how to read LiveList, statistics, the oscilloscope and PROFIBUS DP telegram logs.
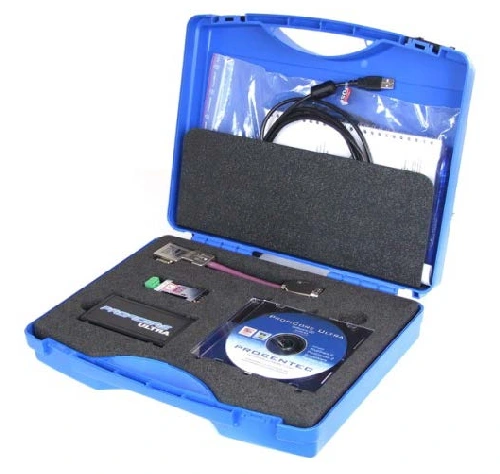
The procedures for ProfiTrace 2 (ProfiTrace2) with the ProfiCore Ultra module are supplemented by actual signal waveforms and measurement examples.
Scope of the manual
This guide focuses on PROFIBUS DP diagnostics in ProfiTrace 2. The screenshots show an older Czech interface; the appearance of windows and the names of some options may differ in later versions. ProfiCaptain’s active functions depend on the licence. Distinguish between passive communication monitoring and tests in which cabling is disconnected or stations are controlled.
PROFIBUS tester and its diagnostic tools
A PROFIBUS tester is used to monitor communication, diagnose faults and verify that they have been rectified. It allows you to monitor messages between devices, the quality of the electrical signal and the behaviour of individual stations. When selecting a tester, compare the features required for your specific installation, the connection method, operation and price.
PROFIBUS Tester Selection
- Reading and recording telegrams using a trigger based on specified conditions. This helps to capture even irregular faults, such as an outage that occurs once a week.
- Filtering recorded messages to display only those required, e.g. filtering messages for a specific station only, or only repeating messages, corrupted messages, diagnostic messages, etc. A very useful function when investigating the causes of network faults.
- A clear overview of the list of active stations on the network, including a display of their status (OK, station parameterisation error, configuration error, query retry, etc.).
- An oscilloscope for checking cabling, connectors and signal waveforms. It is also important to distinguish between telegrams sent by the MASTER and SLAVE stations.
- Portable design for measurements at the start, middle and end of a segment, and behind repeaters. Power supply via USB from a laptop makes work easier even in a control cabinet without a 230 V socket.
- Keep the load on the measured network as low as possible. Use the designated Tap Connector for connection. An unsuitable or excessively long tap alters the electrical conditions and causes signal reflections.
ProfiTrace 2 features
ProfiTrace 2 combines several diagnostic tools. The availability of specific functions depends on the licence and the kit’s configuration:
- A high-speed, full-featured PROFIBUS analyser with minimal impact on the PROFIBUS network
- Reading and recording PROFIBUS telegrams, including DP, PA and DPV1 network messages
- Comprehensive statistics on the status and messages of all stations on the network
- An oscilloscope for the B-A differential signal and separate waveforms for conductors A and B, with the option to select telegrams from a specific transmitting station.
- Voltage graph at stations, displaying the voltage at all stations simultaneously
- Connection to PROFIBUS DP via a 9-pin D-sub connector; M12 requires a suitable adapter. Direct PROFIBUS PA measurement requires PA Probe Ultra and is intended for non-hazardous areas.
- Scanning the network topology, including the cable length between stations
- Active diagnostics and MASTER station simulation in ProfiCaptain, subject to the licence purchased.
- Generating a report with measurement results for service documentation and network status assessment.
- Czech program interface and the ability to generate PDF reports. Available language versions depend on the installed version of the program.
ProfiCore connection and first start-up of ProfiTrace 2
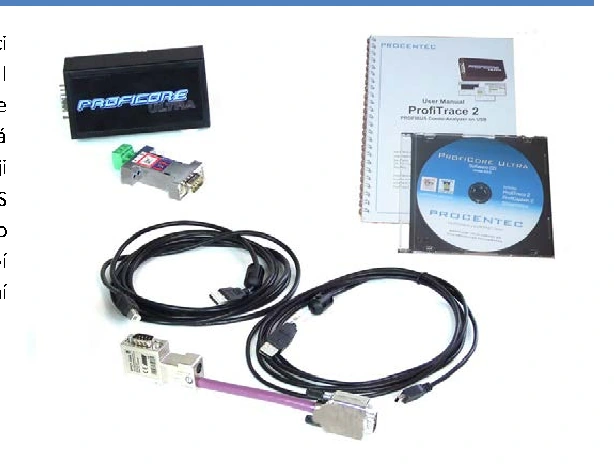
Install the ProfiTrace 2 program and the required ProfiCore driver from the installation package. Connect ProfiCore Ultra to your laptop via USB, which also supplies power to the device. Connect the short Tap Connector cable to the pass-through PG port on the PROFIBUS connector. Even a short tap has an electrical effect on the bus; do not use any long cable instead.
ProfiTrace 2 licence
Open the HMS Anybus Diagnostics licence portal
The ProfiTrace 2 licence is linked to the ProfiCore Ultra serial number. The licence file can be installed on multiple computers; however, the relevant ProfiCore must be connected when performing measurements. The licence is stored in a file with the extension .pld.
Obtaining and installing the licence:
1) Open the HMS Anybus Diagnostics licence portal. Select Product Group: PROFITRACE, enter the kit order code, the ProfiCore serial number and Major Version: 2.
2) The serial number can be found on the underside of the ProfiCore. The downloaded licence file must match this number.
3) Install the file via Help > License info tool. If installing manually, save it to the ‘App’ folder in the ProfiTrace installation directory or to C:\ProgramData\procentec\proficoreultra.
Alternatively, connect your computer to the internet, initialise ProfiCore, and in the licence dialogue box, select Download & Install license. If the dialogue box does not open, you can find it via Help > License info tool.
Program preparation
After launching the newly installed ProfiTrace 2 application for the first time, you must carry out the following:
1) Check that the driver and licence for the connected ProfiCore are installed.
2) Set the program language via Settings > Language.
3) Copy the GSD files for the devices you wish to measure into the GSD subfolder of the ProfiTrace installation. Then reload the GSD library. Detailed instructions can be found in the chapter on GSD files.
Back to contentsPROFIBUS Network Measurement Rules
1) First, check the installation: cables, connectors, terminations, shielding, bonding and possible sources of electromagnetic interference. In addition to the physical layer, also check the station addresses, the CPU’s hardware configuration and the correct GSD files.
2) A failure is caused by a single serious fault, such as a short circuit, or a combination of several minor faults. The network sometimes continues to operate even with faults, and further deterioration will cause it to fail. FOXON therefore recommends preventive diagnostics of all segments at least once a year; adjust the interval according to the importance of the line and the operating conditions.
3) The tester provides waveforms, statistics and telegrams. To determine the cause, the results must be combined with knowledge of the actual wiring and PROFIBUS installation rules. The graph alone cannot reliably determine the location or type of each fault.
4) For the first measurement, select the start or end of the segment. You will need a suitable connector with a through PG port. If you cannot find one at the end, take the measurement from another accessible location and make a note of this position.
5) Repeaters and OLM optical modules divide the installation into separate electrical segments. Measure the physical signal quality in each segment separately. The tester will detect communication from remote stations even through a repeater, but it will not measure their original electrical signal beyond it.
6) Where possible, carry out passive diagnostics whilst the line is under normal load. The operation of motors and frequency converters will reveal interference that may not be apparent when the machine is at a standstill.
7) For an initial check, monitor the network for approximately 5-10 minutes. This interval does not rule out an intermittent fault. For irregular outages, use a longer monitoring period and a telegram recording trigger.
8) If you detect faults in the network (particularly on an oscilloscope or bar chart), carry out another measurement from the other end of the segment. We do not recommend drawing conclusions based on the results of a single measurement.
9) Before connecting, check the network status and the termination of the Tap Connector. The passive analyser has a low electrical load, but in the case of a faulty installation, we cannot guarantee that connection will not affect communication.
a. During normal passive measurement, leave the Tap Connector’s terminating resistor OFF. Additional termination within a segment that is already correctly terminated will load the bus and reduce the amplitude. In the original example, a drop of approximately 0.5-1 V was observed; this is not a universal value. When enabling termination during a standalone interface test or a specific configuration, assess this based on the actual wiring.
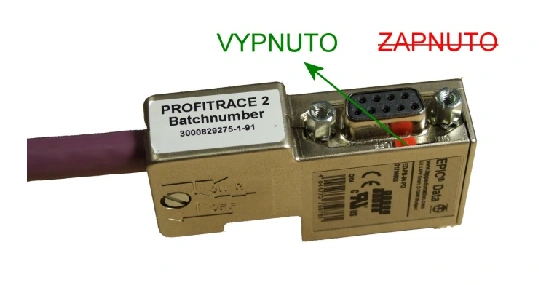
b. In a network with little remaining signal-quality margin, even the small effect of connecting the tester can cause an outage. Plan measurements with the operating and maintenance staff; after finding a fault, check the entire segment from several points.
Back to contentsStarting a measurement and baud rate
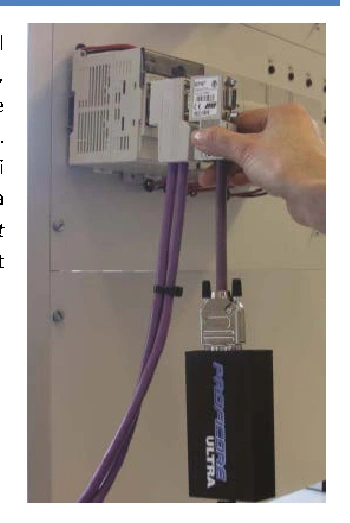
Connect ProfiCore via USB, launch ProfiTrace 2 and initialise the device. After checking the licence, the program detects the PROFIBUS baud rate. If detection is successful, the station will appear in the LiveList. If automatic detection fails, set the known baud rate of the network under test in the analyser using the ‘Set baud rate’ button. This changes the analyser’s settings, not the baud rate of the operational network. If you still cannot see the station, check the connection and ensure communication is taking place.
Back to contentsLiveList and station statistics
LiveList - list of live stations
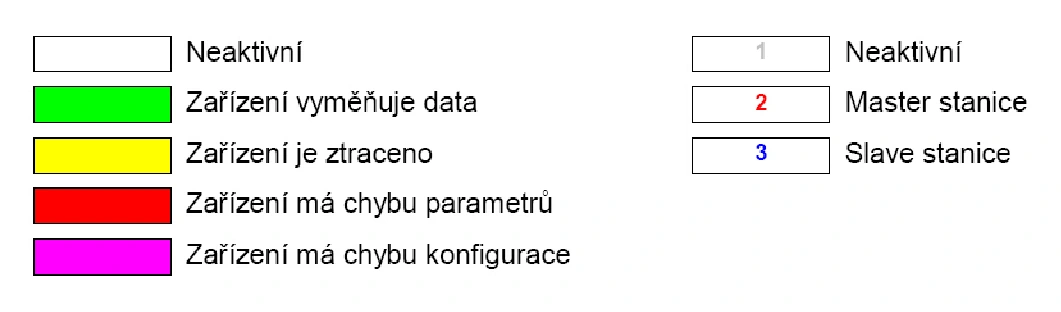
ProfiTrace tab - LiveList
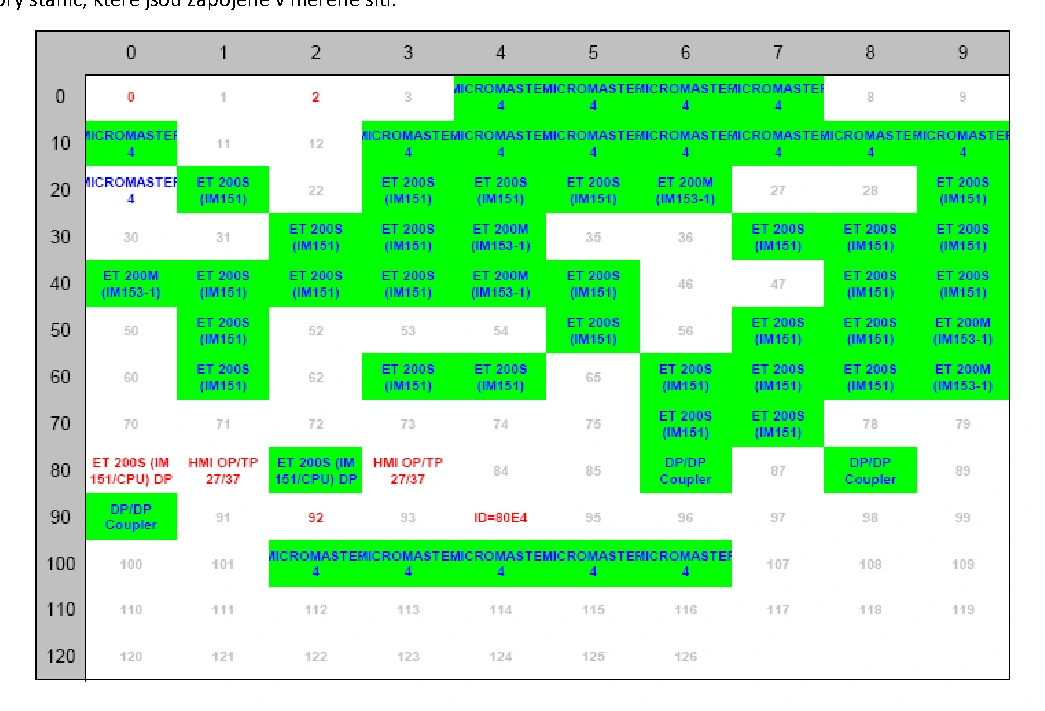
LiveList displays station addresses and their status. A red digit indicates MASTER, a blue one SLAVE. If the colour of the digit alternates, the device can operate in both roles, for example, some operator panels. Distinguish the colour of the digit from the background colour of the field.
The background colour of the numbers in LiveList has the following meanings:
- Green background: the SLAVE station is engaged in cyclic data exchange with the MASTER station. The green colour alone does not confirm an error-free electrical signal.
- White colour = the station is not actively communicating with the MASTER. The station has its own address and is on the bus, but the MASTER is not aware of it. The programr has probably forgotten to add it to the CPU’s hardware configuration, or conversely has deliberately not added it yet - it is merely prepared for now. Another possible reason could be an incorrectly set PROFIBUS address for the station in question.
- Yellow colour = the station was lost during the test. This was likely caused by a physical disconnection of the station’s cable, a short circuit in the cable, etc.)
- Red colour = the station has a parameterisation error. This is often caused by an incorrect GSD file being loaded into the MASTER station. The tester displays the station in red and simultaneously shows the station’s identification number. The ID number of the selected GSD file must match this ID number.
- Purple colour = the station has a configuration error. The configuration loaded into the CPU does not match the IO modules installed in the SLAVE station. ProfiTrace 2 will display a list of the IO modules configured in the CPU. You can then check for yourself whether they match the IO modules plugged into the station. If you have also purchased a ProfiCaptain licence, you can remotely read the modules that are physically installed in the given SLAVE station.
- A flashing red corner of a box: the station is reporting extended or static diagnostics. Click to view details. The cause may be, for example, a faulty I/O card or unready process data; it may not necessarily be a bus fault.
Viewing station statistics
ProfiTrace tab - Station statistics view
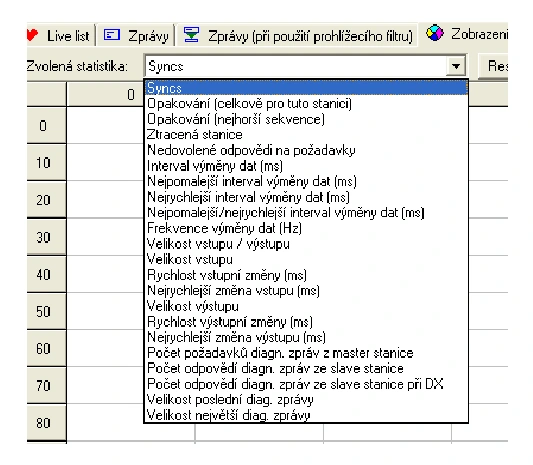
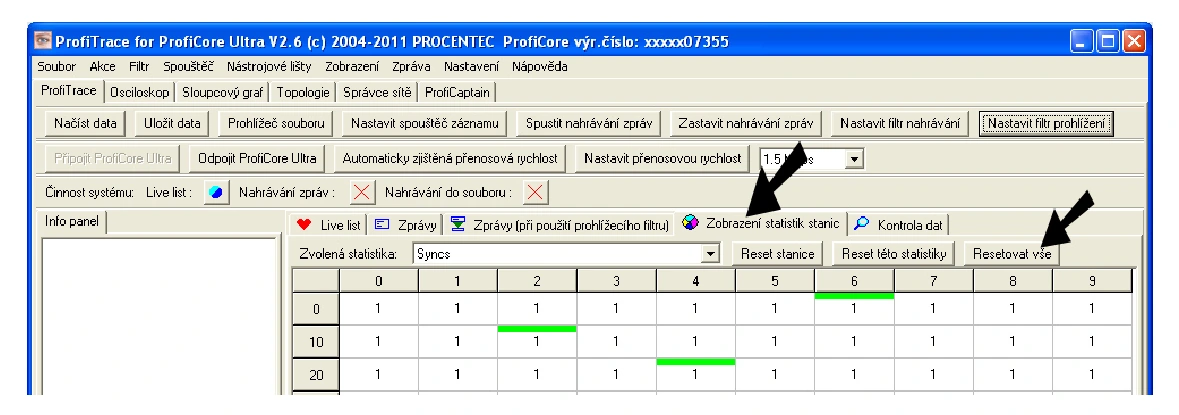
For an initial assessment, pay particular attention to Syncs, retries, the worst-case retry sequence, lost stations, invalid messages and diagnostics during data exchange (DX). After the initial start-up and your own active queries, create a new baseline for the statistics. Investigate any increase in errors during steady-state operation; the general number of permitted retries cannot be determined solely on the basis of network speed.
Key statistics
- Syncs: the analyser records the start of communication between the MASTER station and a given station. These should appear at start-up or following a deliberate restart. Their repeated increase during steady-state operation indicates new connection attempts and requires investigation. Do not confuse this statistic with the SYNC output synchronisation mode.
- Retries: the MASTER retransmits a request because it has not received the expected response. The number of attempts depends on the network settings. Persistent loss of responses interrupts data exchange and leads to renewed communication establishment.
- Retries, worst sequence: the highest number of consecutive retries. Compare this with the configured retry limit. For example, two retries mean the original request plus two further attempts; this is not a fixed property of every network.
- Lost station - the number of times the SLAVE station was lost during tester measurements, i.e. the number of times it was disconnected from the network, or experienced a power failure, a short circuit on the cable, etc.
- Invalid responses to requests: corrupted or invalid messages, for example with parity or format errors. Look for a link to low amplitude, interference, damaged cabling, connectors or a short circuit. In some examples the amplitude fell below 2.5 V; assess the complete signal waveform together with the associated statistics.
- Number of responses from the SLAVE station during DX - this statistic records the number of ‘complaints’ from the SLAVE station to the MASTER station. PROFIBUS devices have basic communication diagnostics designed to diagnose the MASTER-SLAVE connection. However, many devices also feature so-called ‘extended diagnostics’, which help us to pinpoint problems with the station itself or with connected IO peripherals. It often happens that a SLAVE device reports an error, but this error has nothing to do with PROFIBUS. The MASTER-SLAVE connection is fine; however, the fault lies in the peripherals connected to the SLAVE station, or possibly in a faulty IO card within the SLAVE module.
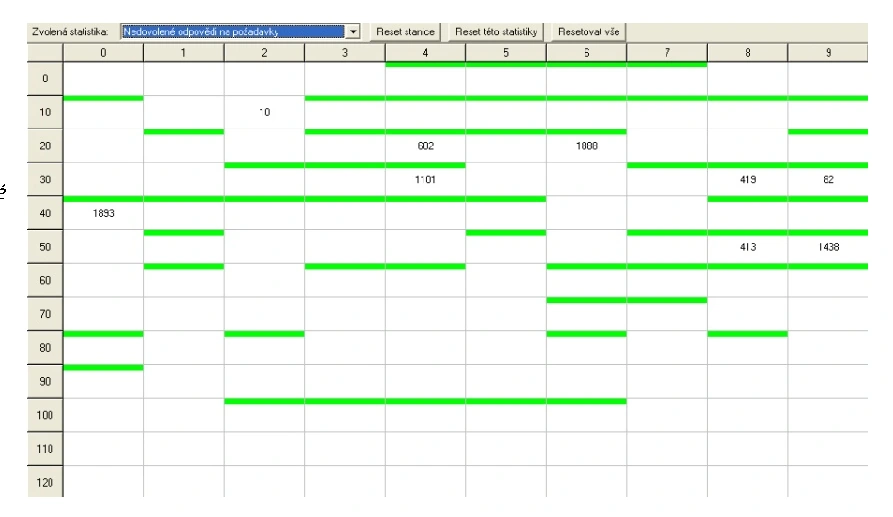
Example of ‘Invalid Responses to Requests’ statistics. We can see the number of incorrect messages associated with each address on the PROFIBUS network.
Back to contentsPROFIBUS oscilloscope and signal analysis
The oscilloscope captures telegrams transmitted by individual stations at the point where the tester is connected. By selecting an address, you can view the telegram waveforms for that station without having to reconnect the tester each time. However, this is not a direct measurement of the voltage at the station’s remote connector. To locate a fault, compare measurements from multiple locations; measure each electrical segment separately.
Measured voltage:
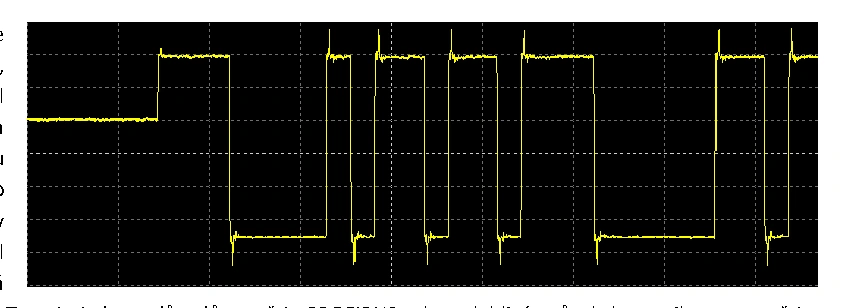
- B-A: the differential signal between conductors B and A. Interference that is transmitted equally to both conductors is largely suppressed in the differential view. This mode is therefore used for basic PROFIBUS signal checks.
- A & B: the individual waveform of each conductor relative to the reference. This mode helps to distinguish between asymmetry, a damaged conductor and interference, which the differential display partially conceals.
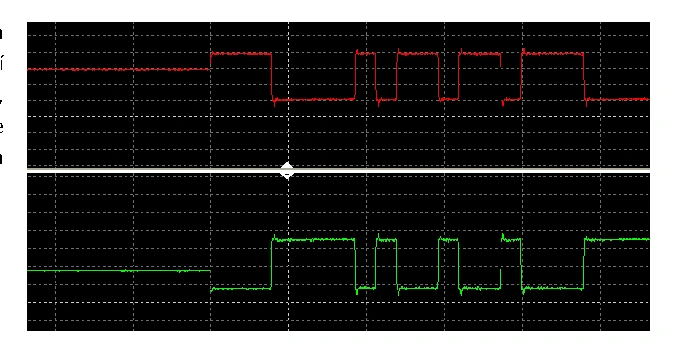
At the bottom of the window, select a station in the LiveList by double-clicking it. Check the telegrams of all available transmitting stations in the measured segment one by one.
Reflections make it difficult to pinpoint the location of a fault. The telegram that looks the worst may not originate from the station closest to the fault.
In the following example, the reflection manifests as follows:
- At a station close to an incorrect termination, the signal has a relatively favourable shape.
- At the station on the opposite side of the segment, the same problem is more clearly evident due to the reflection delay. Verify this situation by checking the topology and taking measurements from both ends; this is not a general rule applicable to all faults.
Example: We have a correctly wired PROFIBUS network, comprising 1 MASTER and 5 SLAVE, with a resistor correctly connected at each end of the segment. The measured signals are as follows:
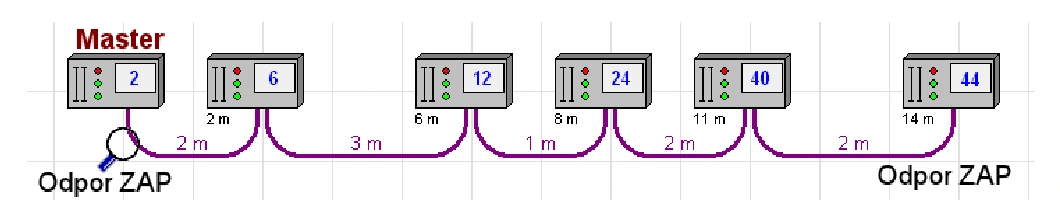
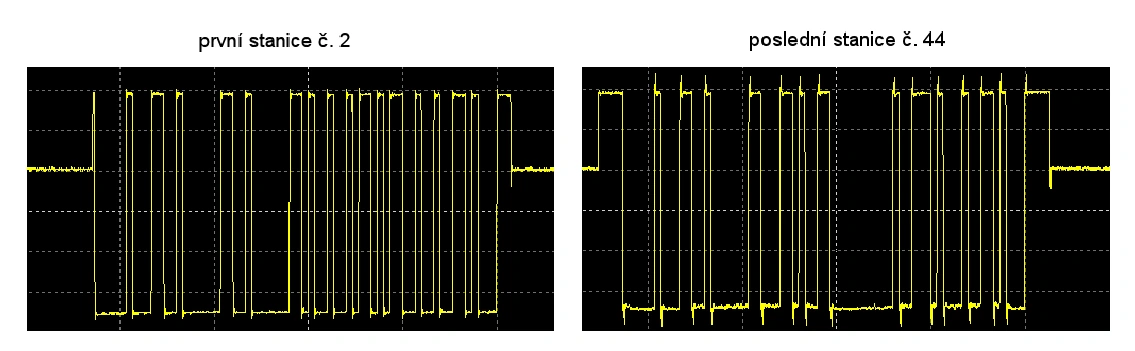
In the demonstration network, the terminating resistor of the last station, No. 44, was subsequently switched off. The signal at this station appears more favourable, whilst at station No. 2 at the opposite end, it is significantly distorted. Do not switch off the termination in the live network for the purposes of this demonstration.
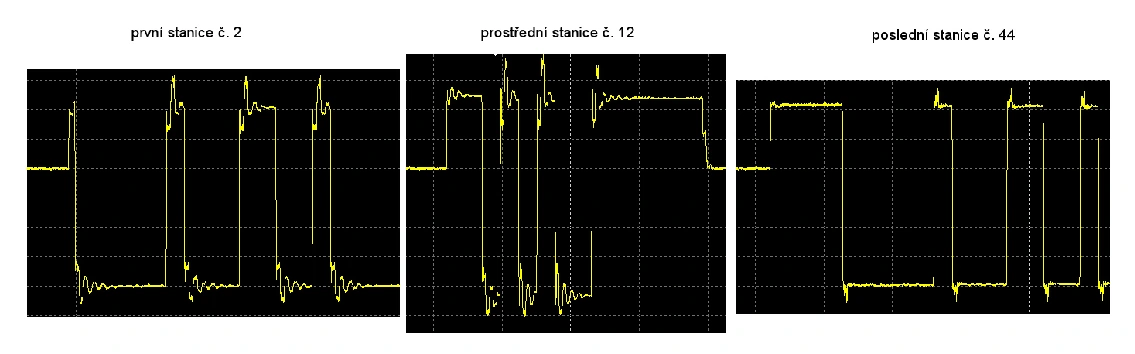
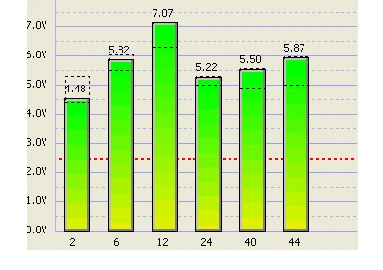
In this example, the cause lies at the opposite end of the segment to where we see the worst signal waveform. Simply evaluating the appearance of the signal from station No. 2 would lead to an incorrect conclusion.
Back to contentsExamples of PROFIBUS signals and faults
Standard signal
The following figures show waveforms at various transmission speeds. Assess minor overshoots at the edges in conjunction with the settling time and communication statistics. Significant dips towards the zero differential level or distortions within a bit require investigation. The cause is usually a reflection, short circuit, improper termination or damaged cabling.
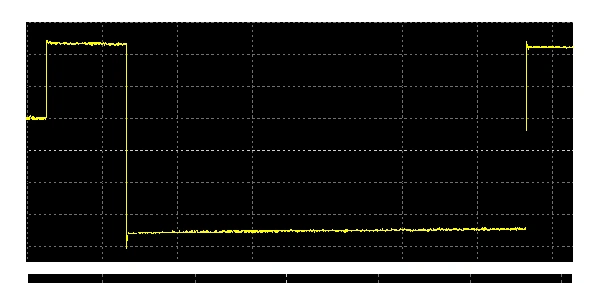
Signal at 187.5 kbit/s. The time display corresponds to the original oscilloscope screenshot.
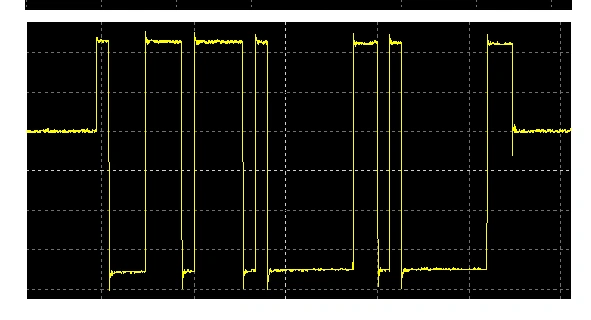
Signal at 1.5 Mbit/s. Compare the waveform on an appropriate time scale.
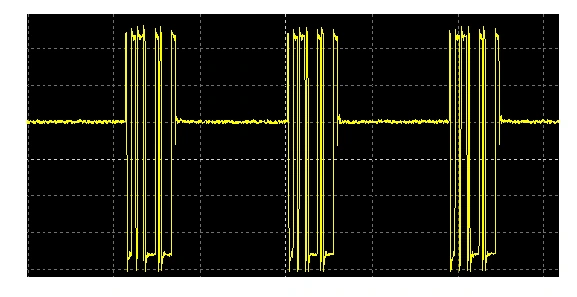
Signal at 12 Mbit/s.
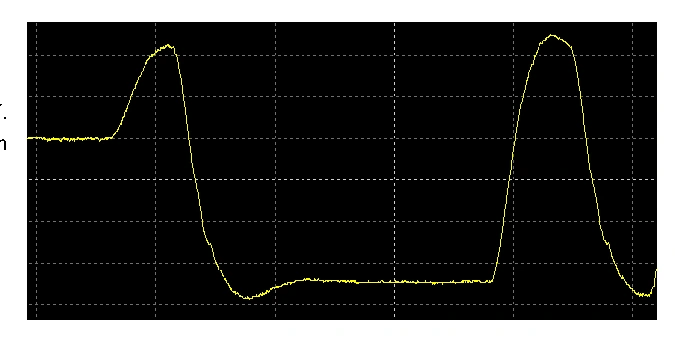
A rounded-off signal from the far end of the segment requires checking the length and quality of the cable, the connectors and the permissible topology. If the segment needs to be split, select a suitable repeater, such as the B1, and verify its placement by taking measurements.
Signal reflections
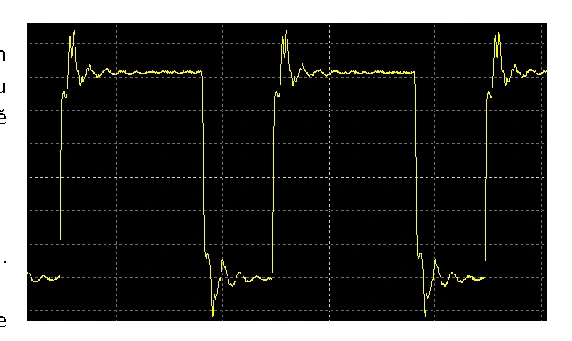
Reflections occur at changes in line impedance, for example at branch points, incorrect termination or damaged cables and connectors.
Possible reason:
- disconnected resistor at the end connector/repeater/etc. device in the segment
- Damaged end connector of the segment. Check the resistors at both ends of the segment.
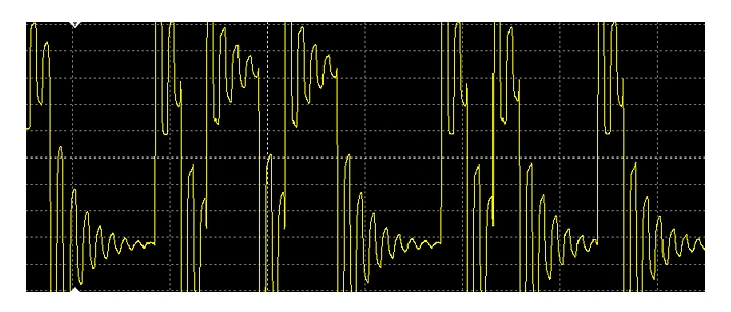
Unpowered segment termination
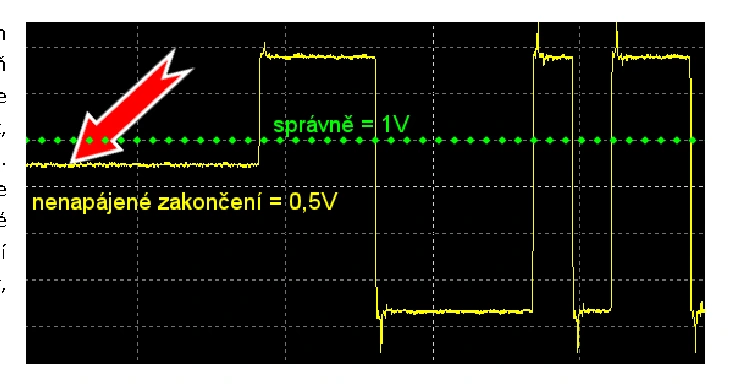
A PROFIBUS DP segment must be correctly terminated at both ends. Termination is usually powered from the relevant station or from an active element. In the event of a power loss, the signal’s rest level changes and the communication margin is reduced. In the example given, it fell from approximately 1 V to 0.5 V; the actual waveform depends on the wiring and the remaining termination.
Possible reason:
- One or both termination circuits at the segment ends are unpowered. Check their power supply.
Open circuits and impedance changes
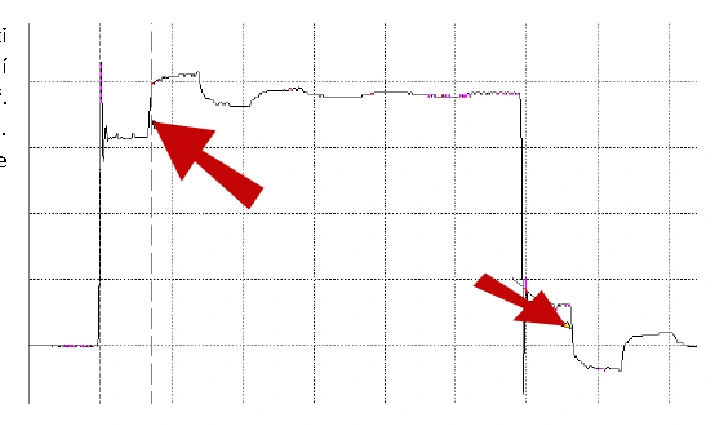
A broken wire, a loose connection or any other change in impedance distorts the waveform. In the example, the signal reaches a certain level and then rises further. Check that connections are tight, that there is continuity in the wires, and that the connectors are secure. Confirm the type of fault by carrying out a further check; the waveform itself is not conclusive evidence.
Short circuit and contact resistance
A short circuit or contact resistance manifests itself as a distortion and a drop in amplitude. In the examples given, the signal level drops towards zero after the edge.
Possible reason:
- Conductor A or B is shorted to ground, or the two conductors are shorted together somewhere in the network, for example at a cable bend.
- a short circuit in the connector due to age, contamination, faulty connector wiring, etc.).
A minor short circuit:
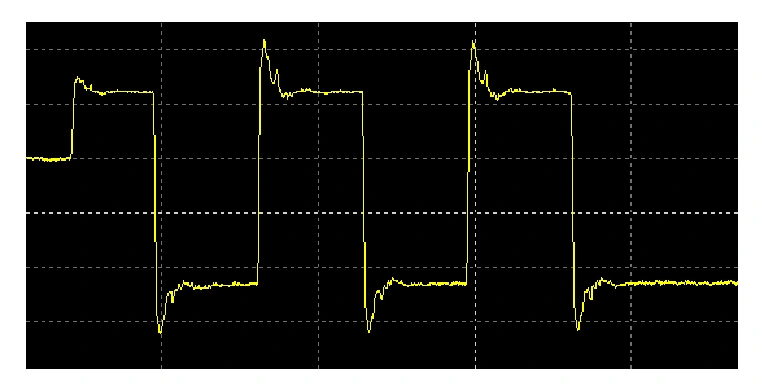
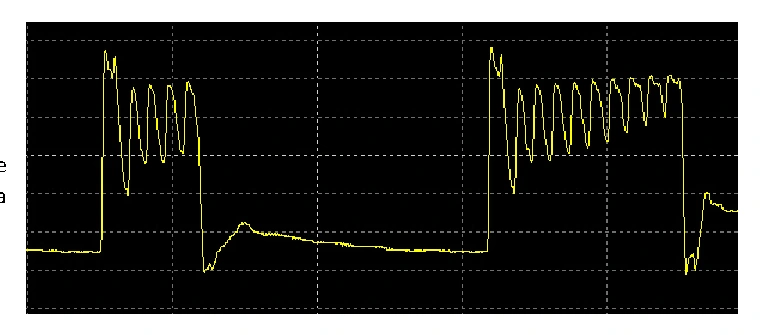
A complete short circuit between the red conductor and the cable shield. Oscilloscope readings at various stations on the network:

Faulty PROFIBUS device interfaces
The device interface itself, such as the CPU port, may be faulty. The following standalone test requires disconnecting the operational cable from the station and therefore taking the relevant connection offline. Carry it out in the agreed service mode. Connect the tester directly to the suspected station and ensure this test configuration is correctly terminated. Do not confuse this with standard passive measurement on a live bus.
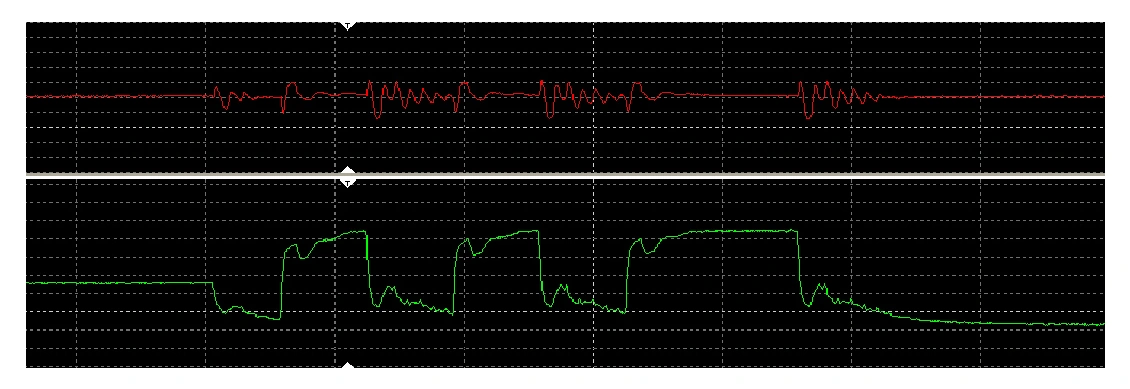
In the example, only station no. 2 is connected. Other previously recorded stations have a yellow background because they are no longer available. After switching to A & B, one of the wires does not show the expected waveform. This narrows the suspicion down to the interface itself and the test connection; before carrying out any repairs, also rule out faults with the connector and cable.
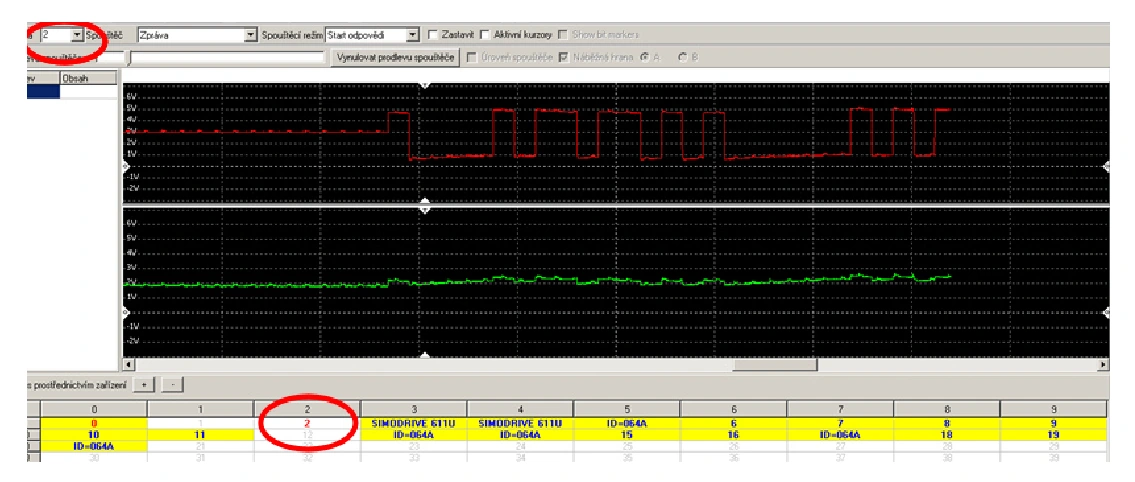
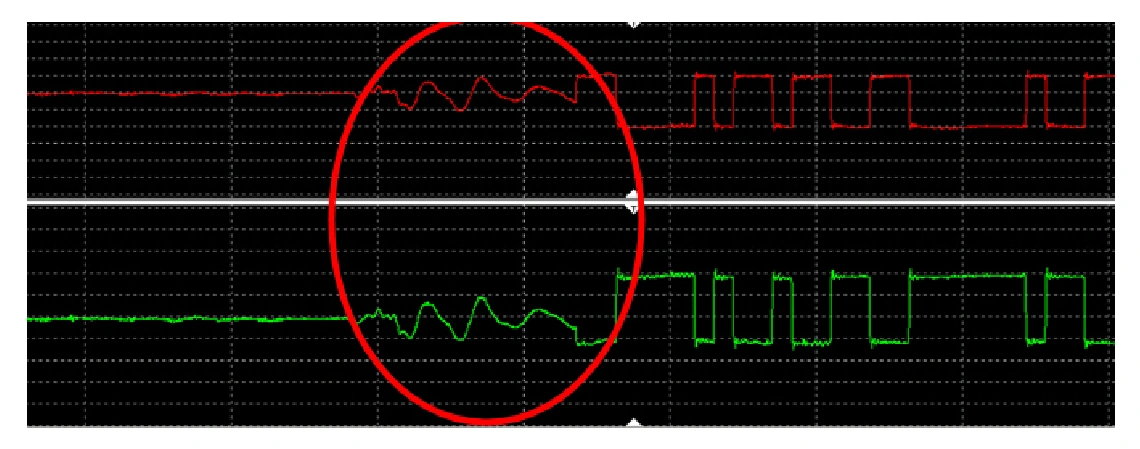
EMC electromagnetic interference
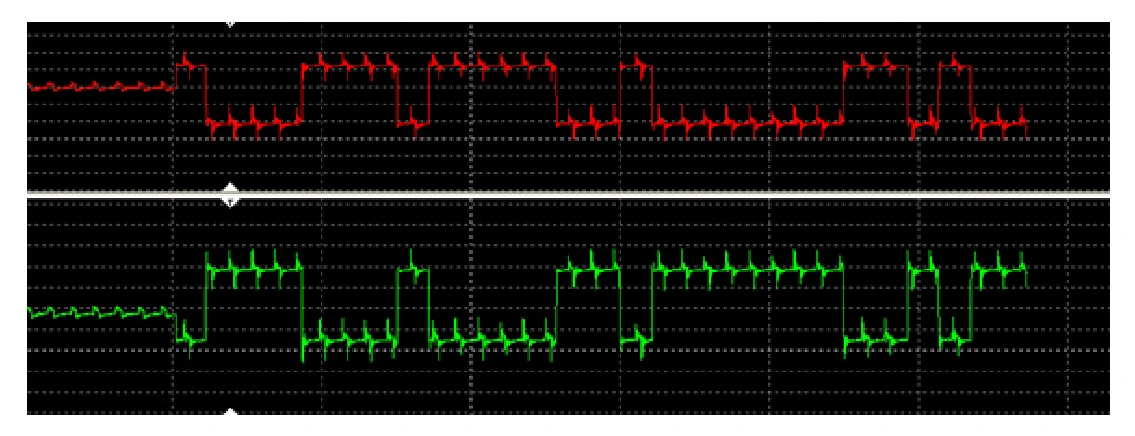
Look for electromagnetic interference by checking the cable route, shielding, bonding and parallel runs with power cables. Check the output cables of frequency converters in particular. Follow the installation rules for specific cables, routing methods and the use of barriers. During a controlled test, check whether moving the cables to a safe distance eliminates the interference on the oscilloscope. In previous cases, rerouting the cables by tens of centimetres has helped; this is not a universally applicable minimum distance.
If the cable route cannot be changed, consider splitting the segment using a suitable repeater and modifying the shielding or bonding. A repeater may limit the propagation of interference between segments, but it will not in itself eliminate the source of interference nor guarantee the rectification of a faulty installation.
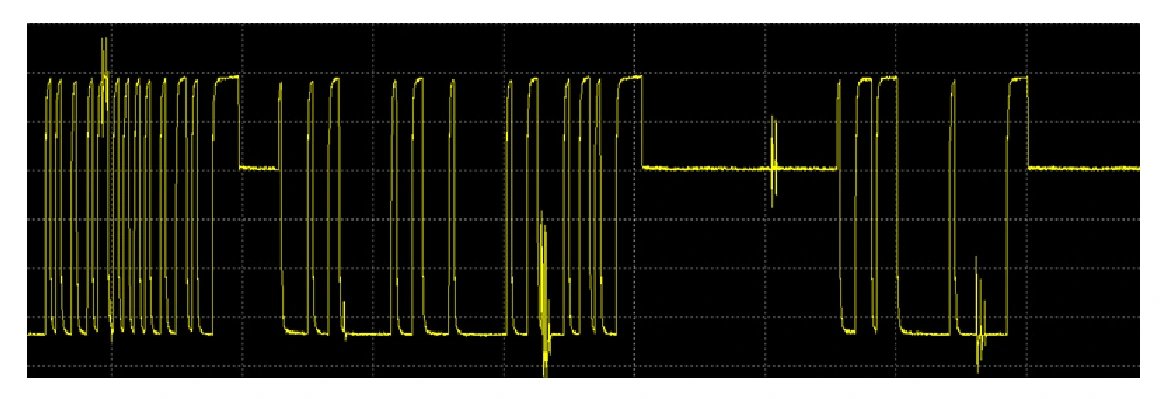
Possible reason:
- The PROFIBUS cable is laid in the cable duct close to the power conductor
- In an effort to organise the cables, an electrician tied the power and PROFIBUS cables together inside the switchboard
- Missing or incorrectly connected cable shielding, for example at the terminals of the SLAVE station.
- The SLAVE station itself generates EMC interference and transmits it to the PROFIBUS network
- Many frequency converters are designed with power cables and the PROFIBUS cable leaving in the same direction. The cables are close together and can easily touch.
Examples of the effects of electromagnetic interference on PROFIBUS communication
Bar chart of station voltages
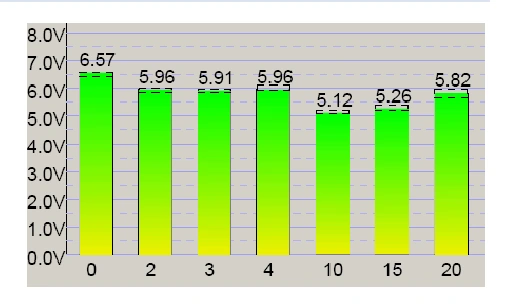
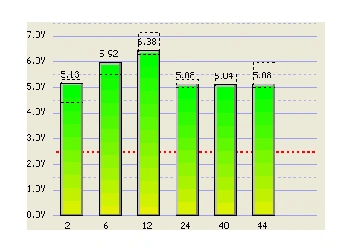
The bar chart shows the amplitude of telegrams from individual transmitting stations at the point where the tester is connected. This is not a direct measurement of the voltage at each remote connector. The typical differential amplitude is around 5 V; assess any suspicious deviations based on the graph mode, oscilloscope readings and statistics. Behind the repeater, you can see its regenerated signal, so carry out a separate measurement there.
Monitor changes in amplitude, stations that differ significantly, and their connection to communication errors. Do not assess the network based on a single numerical threshold alone.
Voltage and actual topology
Each station in the PROFIBUS network has its own address, which can be seen at the bottom of the graph. PLEASE NOTE - although the numbers in the graph are listed consecutively (or can be sorted by voltage level, min-max or max-min), this certainly does not mean that the stations are physically connected to one another in this order! If you wish to eliminate unwanted voltages at stations on a PROFIBUS network, it is important to know the exact topology of the network being measured. Only by knowing this can you determine how the stations are arranged in sequence and which one has what voltage. Methods for detecting network topology can be found in the Topology chapter.
When evaluating the measurements, consider the following:
1) A repeater separates electrical segments and regenerates the signal. Consequently, telegrams from stations downstream of it often have a very similar amplitude at the measurement point. To check their actual physical layer, move the tester to the relevant segment.
2) The transmission speed affects the installation’s sensitivity to cable length, reflections and other faults. At 500 kbit/s, a fault will manifest differently than at 12 Mbit/s. A lower speed does not mean that the cause has been rectified.
3) When the machine is at a standstill, interference caused by the operation of motors and inverters may not be apparent. Compare the signal under a representative operating load.
4) Different interfaces have different amplitudes. A higher value does not in itself confirm a fault or a fault-free state. Check the waveform and error statistics.
5) If an older drive or another station has a noticeably low amplitude, check the oscilloscope, message retries and station losses. A low level may be related to the interface, cabling, segment length or termination.
A low amplitude in itself is not a reason to replace the entire drive. First, verify the installation from multiple measurement points and check for any link to communication losses. Depending on the result, choose to repair or replace the interface or device, or modify the segment with a suitable repeater. Subsequently, verify the change by taking new measurements.
6) Installation faults - the voltage level at the stations is, of course, affected by the quality of the installation itself, i.e. short circuits, broken wires, kinked cables, incorrect cables, poorly connected connectors, etc. The effects of these faults are illustrated in the following graphs.
Examples of voltage graphs
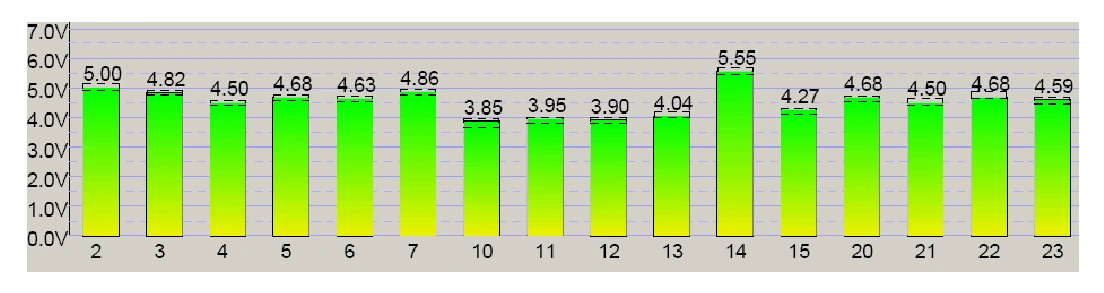
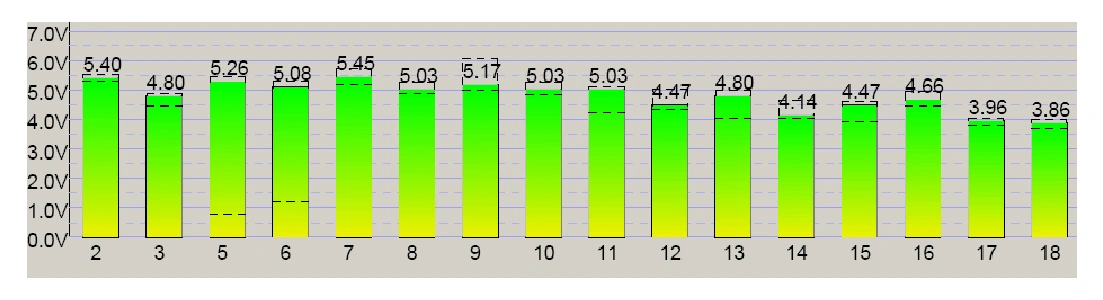
Compliant voltage
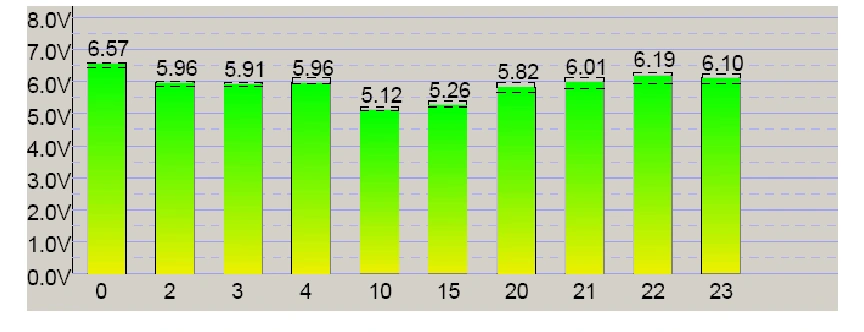
The following graphs show examples of installations in which no errors or message retries were observed during measurement. The amplitudes of individual stations may not be identical. Do not infer a universal voltage tolerance from the graph; always assess it in conjunction with an oscilloscope and statistical data.
Repeater in the network
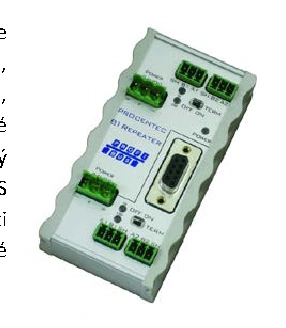
1) After connecting to the start of the segment, we see very similar amplitudes for stations 66-86 and also stations 2, 40, 42 and 46. In this example, this suggests a shared segment behind the repeater, whose signal measures approximately 6.24 V at the measurement point. A standard transparent repeater does not have its own PROFIBUS address, which is why you will not find it in LiveList. Locate it physically and check which stations are upstream and downstream of it.
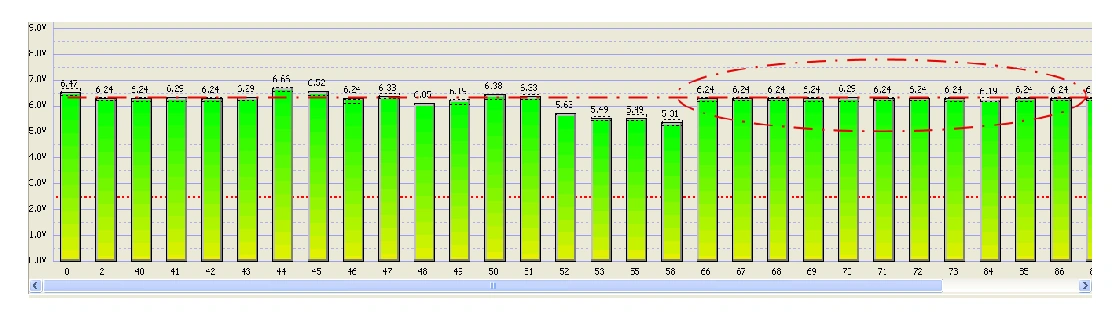
Similar signal amplitudes at stations 66-86 and 2, 40, 42, 46 are an indication that the repeater and topology should be checked; this alone does not prove their location.
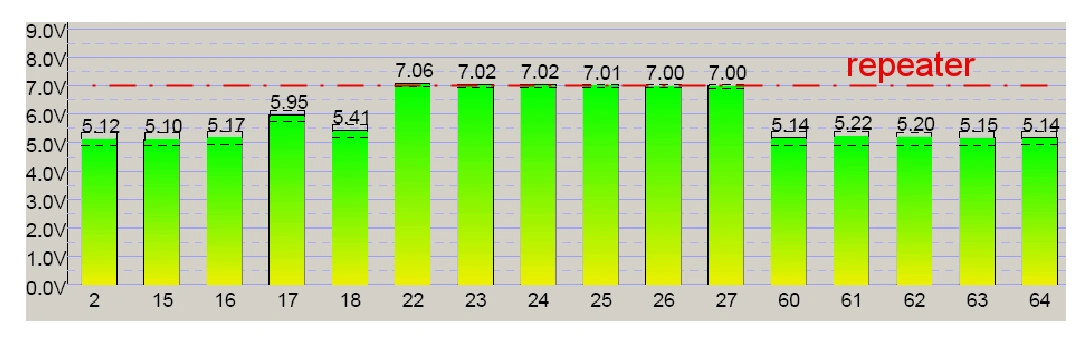
In this example, stations 22-27 are located downstream of the repeater and have very similar amplitudes. The other stations differ. When measuring an unknown installation, first verify this interpretation against the cabling.
Voltage drop across a section of the segment
We connected the tester to the MASTER (No. 2), activated the MASTER station simulation (No. 0) in the tester, and can see the voltage at the other SLAVE stations on the network. At first glance, it is evident that the voltage level is approximately 3.6 V, which is the same for the vast majority of stations. In this case, the sequence of station numbers corresponds to the actual wiring, so the network topology is indeed 2 ↔ 40 ↔ 41 ↔ 42 ↔ 43 ↔ 44 ↔ etc. There is a clear, undesirable change in voltage between stations 41 and 42, where the voltage then remains at the same level for the subsequent stations. The problem must be sought between these stations, i.e. by checking the cable, checking the connectors, etc. In this case, the fault lay in the terminating resistor of the connector at station No. 41, which was in a certain ‘intermediate position’ and, as a result, connected the resistor to the outgoing cable from the connector at station No. 41.
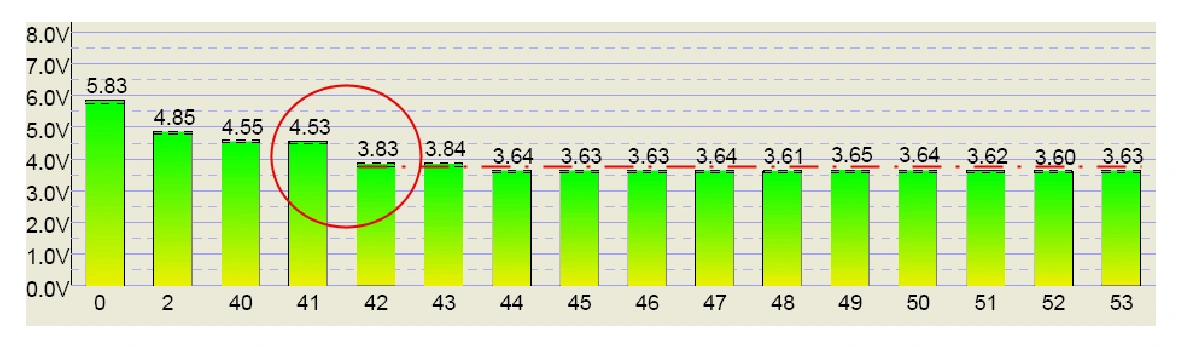
Fig. A noticeable voltage drop indicates a short circuit between stations 41-42 and causes a voltage drop for stations 42-53
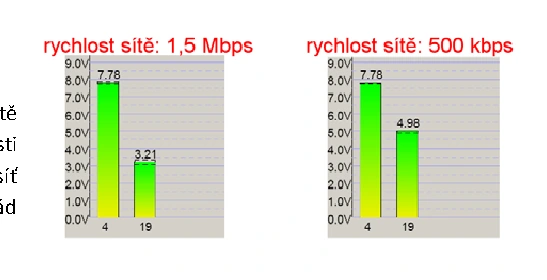
The effect of transmission speed
The example compares the same stations at two transmission speeds. After reducing the speed, the amplitude increased at station No. 19. Changing the speed may temporarily improve communication, but it will not repair the cabling or connectors. Only change the operational network speed as part of a controlled configuration change.
Back to contentsPROFIBUS network topology measurement
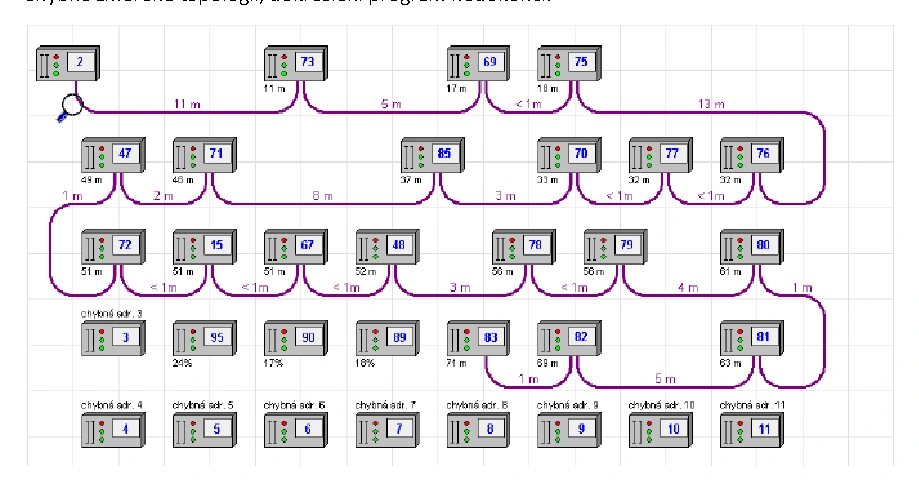
ProfiTrace 2 estimates distances and the order of stations based on the measured electrical characteristics of the segment. The result is a tool for checking the wiring, not a substitute for verifying the actual cabling.
Measurements require a sound, correctly installed segment free from interference, taps and incorrect termination. Results may be inaccurate, particularly for short sections. Distances of less than 2 m or more than 230 m from the measurement point cannot be reliably determined. A minimum of 1 m of cable is assumed between stations. Only stations on the current segment are counted.
1) Topology measurement whilst the line is in full operation
2) Measurements whilst the line is deactivated require an appropriate test configuration and, where necessary, active communication. Do not set this up uncontrolled on the live network.
Topology during line operation
Conditions for measuring the topology whilst the network is in operation:
1) The topological calculation supports speeds of 500 kbit/s and 1.5 Mbit/s.
2) The tester must be connected at the end or beginning of the segment, not in the middle
3) The network must be healthy, i.e. the oscilloscope shows no anomalies in the network, the voltage is correct, network statistics show no errors, etc.
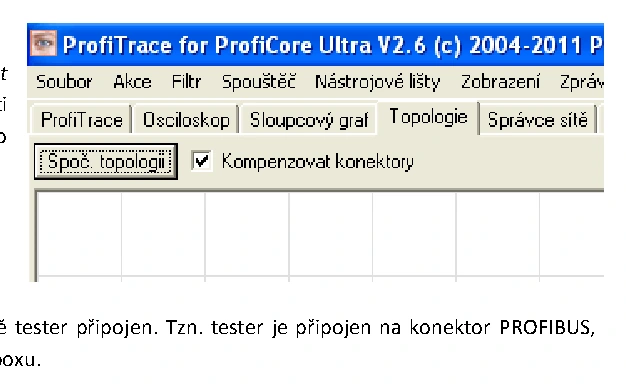
Click on Calculate topology. The option Compensate for connectors includes the electrical characteristics of the connectors in the calculation; consider it particularly for short networks up to approximately 20 m. Always assess accuracy against the actual wiring.
In the following dialogue box, select the network station to which the tester is currently connected. In other words, the tester is connected to the PROFIBUS connector, which is linked to station XY; select its number from the list box.
Examples of measured network topologies:
1) Correctly measured topology
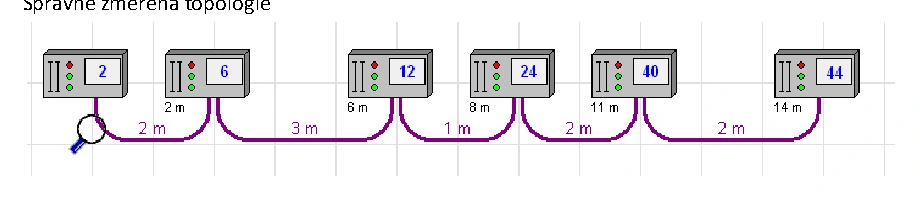
2) Example of an incorrect result: the program fails to draw the topology or displays an unreliable sequence and distances. Do not use such a result as a confirmed network plan.
GSD files
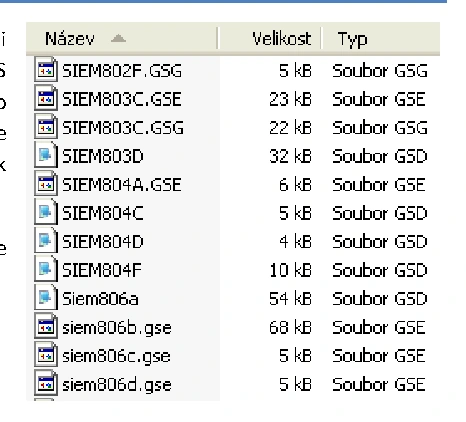
GSD is a text-based description of the characteristics of a specific PROFIBUS device. Engineering uses it to configure the SLAVE station; ProfiTrace uses it to retrieve device names and information for decoding diagnostics. Simply loading the GSD into the tester does not change the CPU configuration.
The base file uses the .GSD extension. Language variants may, for example, have the extension .GSE for English or .GSS for Spanish.
Information in the GSD file
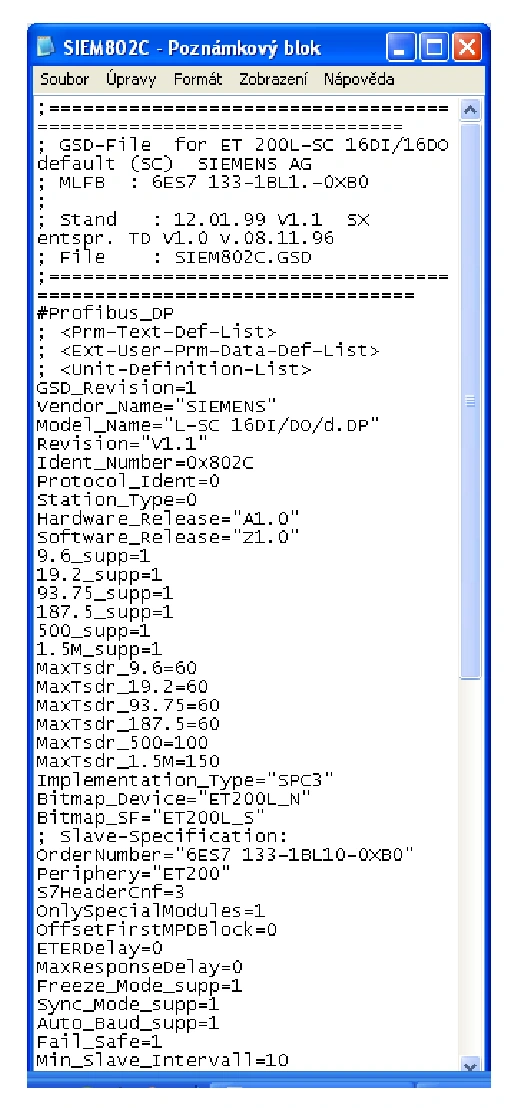
- Manufacturer’s name
- Station identification number
- Identification of supported device variants and hardware or software revisions. Verify the correct GSD for the specific device.
- List of supported network speeds
- Example list of speeds: 9.6; 19.2; 93.75 and 187.5 kbit/s, 500 kbit/s and 1.5 Mbit/s. This list applies to the example device, not to all PROFIBUS stations.
- MaxTsdr: the maximum response time of a SLAVE station for a given speed, expressed in bit times.
- Freeze: support for freezing input data.
- AutoBaud: support for automatic baud rate detection.
- Fail Safe: a property defined in the GSD for behaviour under a specific communication state. It does not replace functional safety nor does it generally guarantee a zero value for all outputs.
SLAVE station identification
In LiveList, station addresses are displayed first. ProfiTrace retrieves the name from the GSD library only after it has captured the device identification number in the diagnostic communication. The mere presence of the correct GSD therefore does not guarantee that the name will be displayed immediately.
Installing GSD files
1) Copy the GSD files for the devices being measured into the GSD subfolder within the ProfiTrace installation. Use files intended for the exact device variant, preferably from the manufacturer.
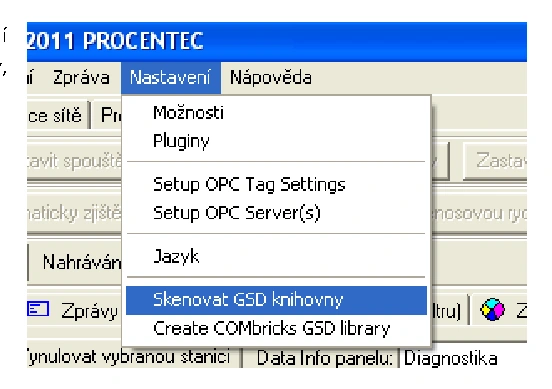
2) Once copying is complete, the GSD file library must be reloaded. This reloading must be carried out whenever new GSD files are copied to the /GSD directory.
Settings - scan GSD libraries
3) Once the GSD files have been scanned, ProfiTrace 2 remembers the station identification number from each GSD file; as soon as this station reports its identification number on the PROFIBUS network, the tester captures this number and converts it to the station name according to the GSD file. If it cannot find a GSD file with the given ID number in the /GSD directory, it will display only this station ID number.
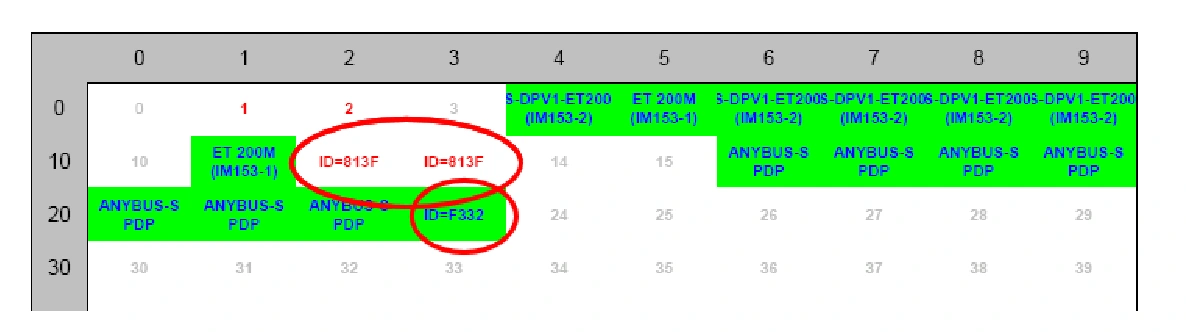
Display of station names
1. When starting up the network - connect the analyser to the PROFIBUS network and switch on the line. As part of the communication initialisation, the MASTER sends a Get Diagnostics command to the network; the SLAVE stations report to it with their ID codes, and in ProfiTrace 2 we can see these ID codes in the LiveList. If we have the correct GSD file in the /GSD directory, the station’s name will be displayed instead of its number.
2. When a station has a fault - if a fault occurs at a station whilst the network is in operation and the station reports its ID code to the MASTER, the ProfiTrace 2 analyser captures this ID code and displays the station name in the LiveList.
3. Active diagnostic query: using ProfiCaptain, you can act as an additional MASTER to request diagnostics and determine identification numbers. This constitutes an active intervention in the communication, which requires the appropriate licence, a free address and the correct network parameters. Please agree this in advance with the responsible technician.
Identification using ProfiCaptain
Active communication with the network
The next step is not a passive measurement. Check in advance that the address is free and verify the network parameters. Do not use the Clear or Operate modes to determine the identification. Carry out active diagnostics only in the agreed workplace mode.
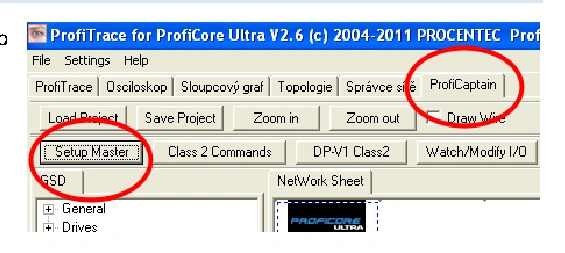
1) In ProfiCaptain, select Setup MASTER. Before activation, select a free address that does not conflict with any station on the network, and check the permissions for active diagnostics. Do not take control of the device or switch to data exchange when reading the identification.
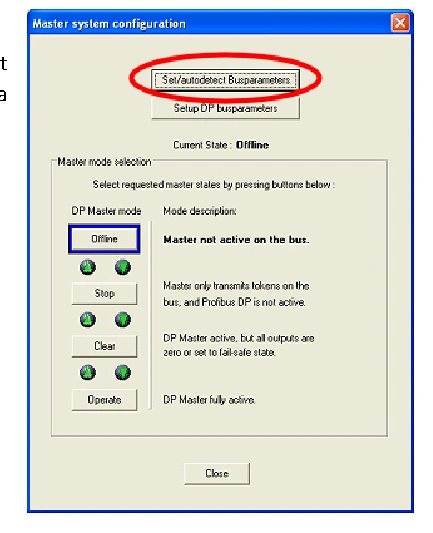
2) Before actually running the MASTER simulation, it is necessary to detect the correct baud rate and other PROFIBUS network settings. Click on the button Set/autodetect Bus parameters.
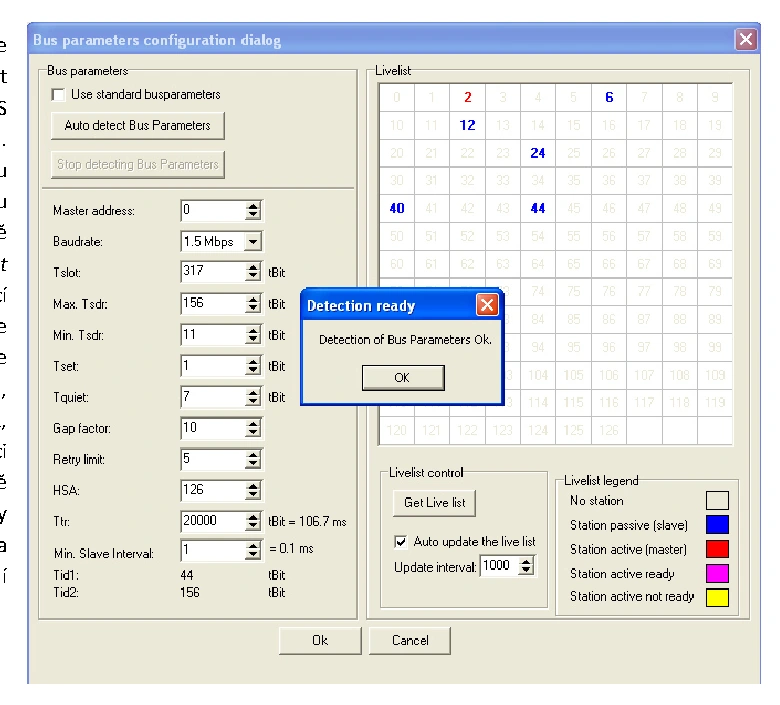
3) In the newly opened window, the option to use standard PROFIBUS parameters is ticked (Use standard busparameters). We recommend disabling this option and, to be on the safe side, having the PROFIBUS network parameters detected again by clicking the Auto detect Bus Parameters. Confirm the following message by clicking OK and the tester will begin to detect the network speed. Once it has determined the correct network parameters, it will enter them into the relevant fields, display the stations found in the station matrix and show a message confirming that detection has been successfully completed. Confirm both dialogues by clicking OK and prepare to run the MASTER simulation.
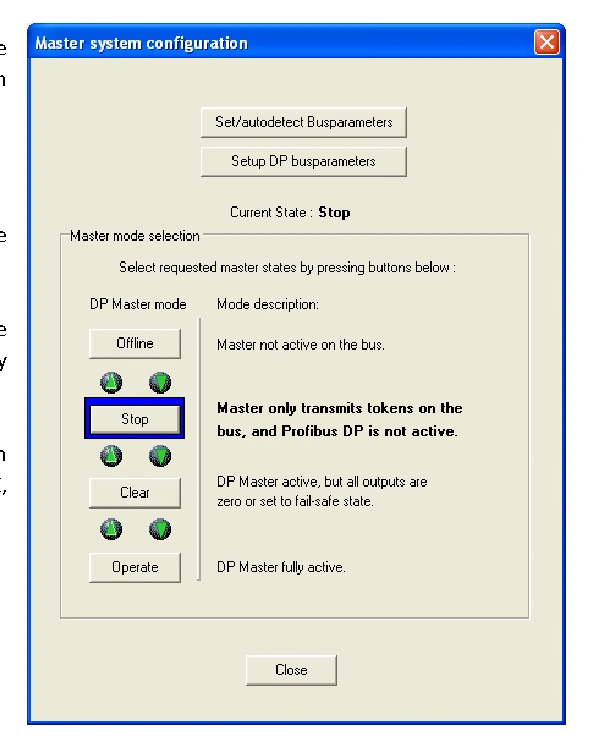
4) In the MASTER simulation menu, there are four levels of MASTER station functionality in the PROFIBUS network, which can be selected by clicking the relevant button.
Offline - MASTER station simulation disabled
STOP - we are connected to the network as a MASTER; we can only send diagnostic messages to the network
Clear - an active mode in which the MASTER can establish communication with stations and operates with the Clear flag. This does not guarantee a safe machine state; actual responses depend on the equipment and configuration.
Operate - full MASTER-SLAVE data exchange, which can control outputs. Do not use this mode merely to determine station names.
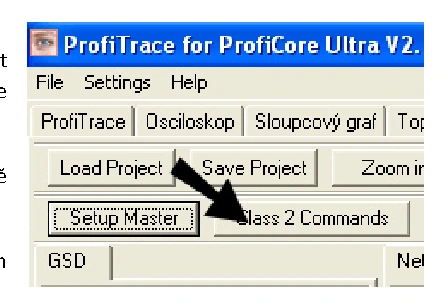
5) To display the station names, we need to send a Get diagnostic message to the network; therefore, we simply need to activate the first mode - STOP. Close the window using the ‘Close’ button.
Press the button Class 2 Commands and in the newly opened window, press Start Scan.
The program displays a list of stations found; close the window using the Close button.
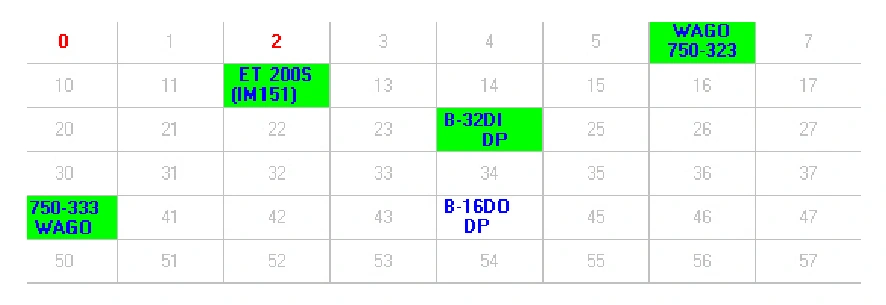
At the top of the tab, click on the first tab, ‘ProfiTrace’. In LiveList, we can now see station names or at least their ID numbers instead of numbers. The station name itself is retrieved from the relevant GSD file stored in the /GSD directory. If no GSD file is available, only the station’s ID number will be displayed instead of the name.
An active scan adds its own diagnostic telegrams to the network and affects the statistics. Once the diagnostics are complete, return ProfiCaptain to Offline mode, save the results so far and reset the statistics before starting a new passive measurement. A diagnostic telegram does not in itself constitute evidence of a fault.
PROFIBUS telegram recording and analysis
In addition to standard tools such as oscilloscopes and voltage level analysers, it is sometimes necessary to carry out PROFIBUS network diagnostics at the most detailed level - i.e. the analysis of telegrams. ProfiTrace 2 can record messages on the network, filter them, search through them and, most importantly, start recording and capture only the messages we are looking for (trigger).
Click the Messages tab and then the button at the top Start message recording. At this point, a log of messages exchanged between the MASTER station and the other SLAVE stations will appear in the window. Using the ‘Place at the bottom’ tick box, we can then choose to display the most recently recorded message on the bottom line of the window.
Example of a communication cycle
The figure shows an example of a PROFIBUS message log from the ProfiTrace 2 tester. We could describe the message log in an easy-to-understand way as follows:
952736) MASTER No. 2 sends a Data Exchange request to SLAVE No. 6. In the subsequent record 952737, a short ACK acknowledgement is received. In this example, the SLAVE does not send any input process data in the data response.
952738) the same applies to SLAVE station no. 12
952740) With each cycle, the MASTER sends the FDL status to a station that is always one address higher. With this query, it checks whether there is a new MASTER station on the network. (2->97)
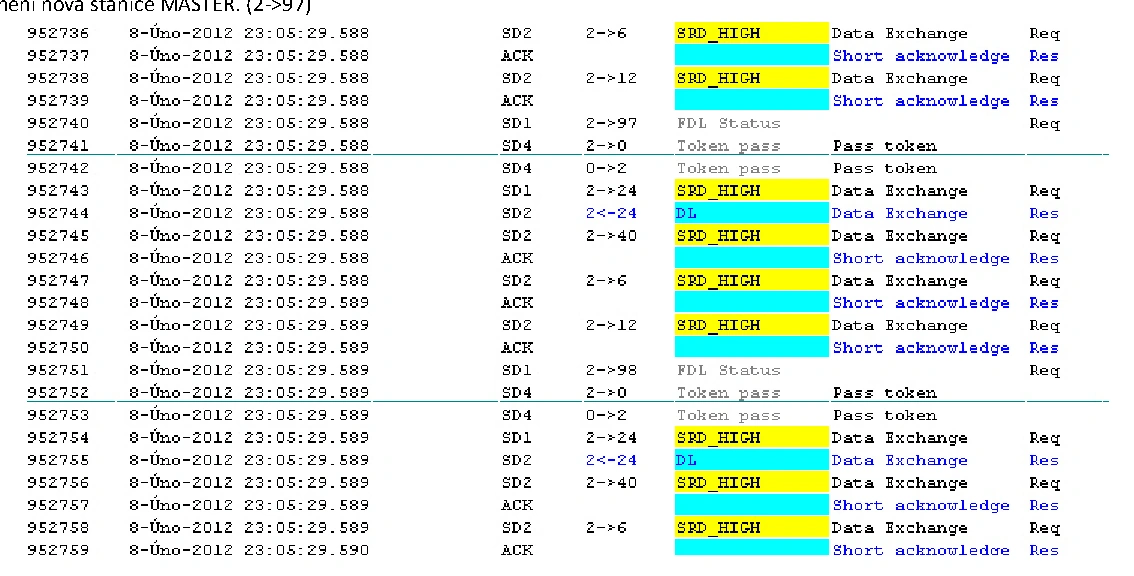
952741) MASTER No. 2 passes the right to communicate with the stations under MASTER No. 0 to the second MASTER, No. 0, on the network. This MASTER has no stations assigned to it: in this example, our tester was connected as MASTER No. 0. We therefore pass the right to communicate with the SLAVE stations back to MASTER No. 2.
952742) MASTER No. 2 sends data to the output of SLAVE No. 24, and the station sends data from its input to it (2<-24).
952745) the same Data exchange between MASTER and SLAVE No. 40
952747) the same Data exchange between MASTER and SLAVE No. 6
952751) The MASTER sends an FDL status to a station with an address one unit higher than in the previous cycle (2->98)
Two lines mark the start and end of a single cycle. The cycle length depends on the number of stations in the network and the communication speed. If we click on ‘View Station Statistics’, we will find the ‘Data Exchange Interval’ statistic and see that, in our case, the cycle length is around 1 ms.
Recording trigger and capture of occasional errors
In the event of an occasional outage, configure the trigger to capture both the error message and the surrounding communication, for example, 100 messages before the event and 100 after it. This will allow you to see what happened before the connection was actually interrupted.
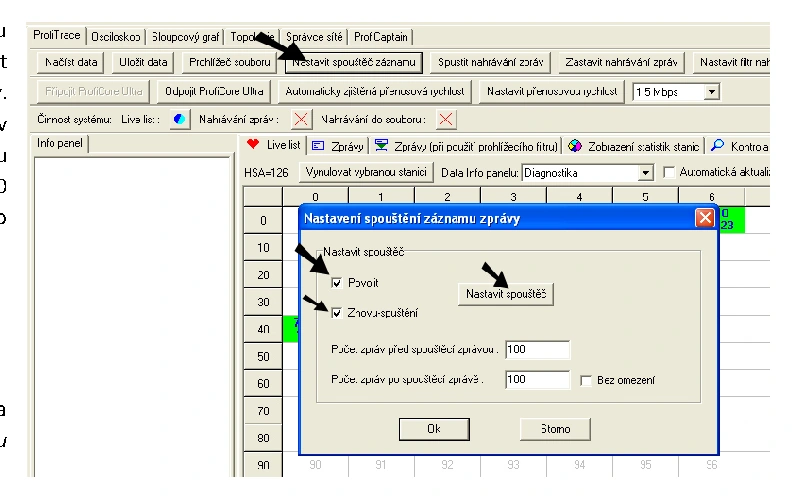
At the top of the program window, click on the button Set up the recording trigger In the open window, set the following:
- Enable = activate trigger settings
- Retrigger: each further occurrence of the trigger condition renews the recording according to the configured number of messages after the event. Choose this option according to whether you need the first event or a longer sequence of repeated errors.
- Number of messages before/after: determine the scope of surrounding communication. Use the number of stations ×4 as a default estimate and verify how many cycles the recording actually contains. In networks with multiple masters or different message types, the number of messages per cycle varies.
Click the ‘Set Trigger’ button and, if you are looking for error messages, tick the following items:
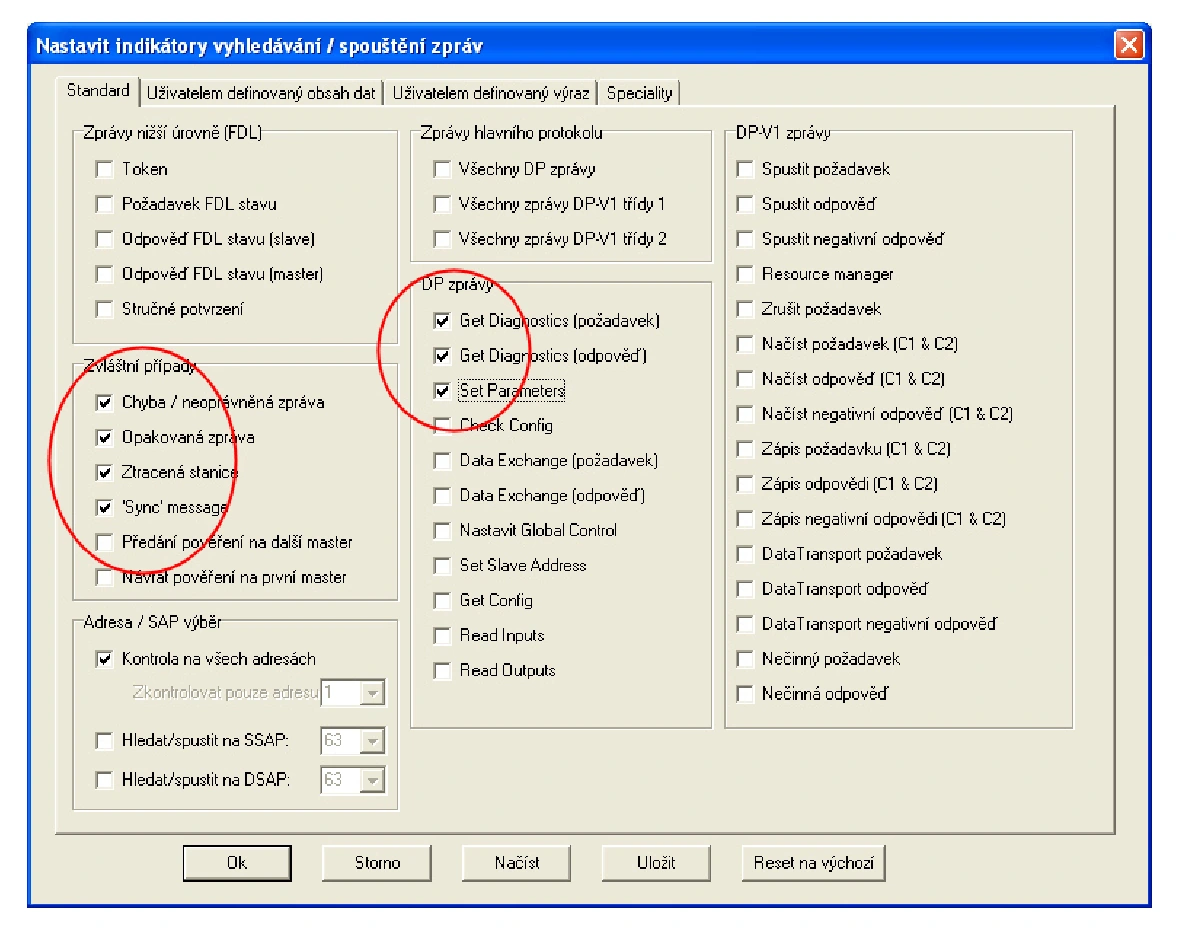
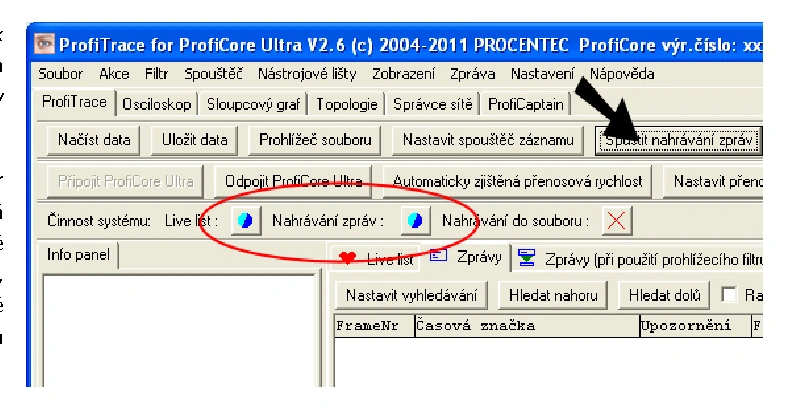
Confirm the selected items by clicking the OK button and then click OK again in the following window. Click the Start message recording button to start recording.
The spinning circles confirm that the tester is monitoring the PROFIBUS network and that messages are being recorded. The message window remains empty until a message we wish to capture appears on the network. Captured messages can be saved via the File → Save → Message File menu.
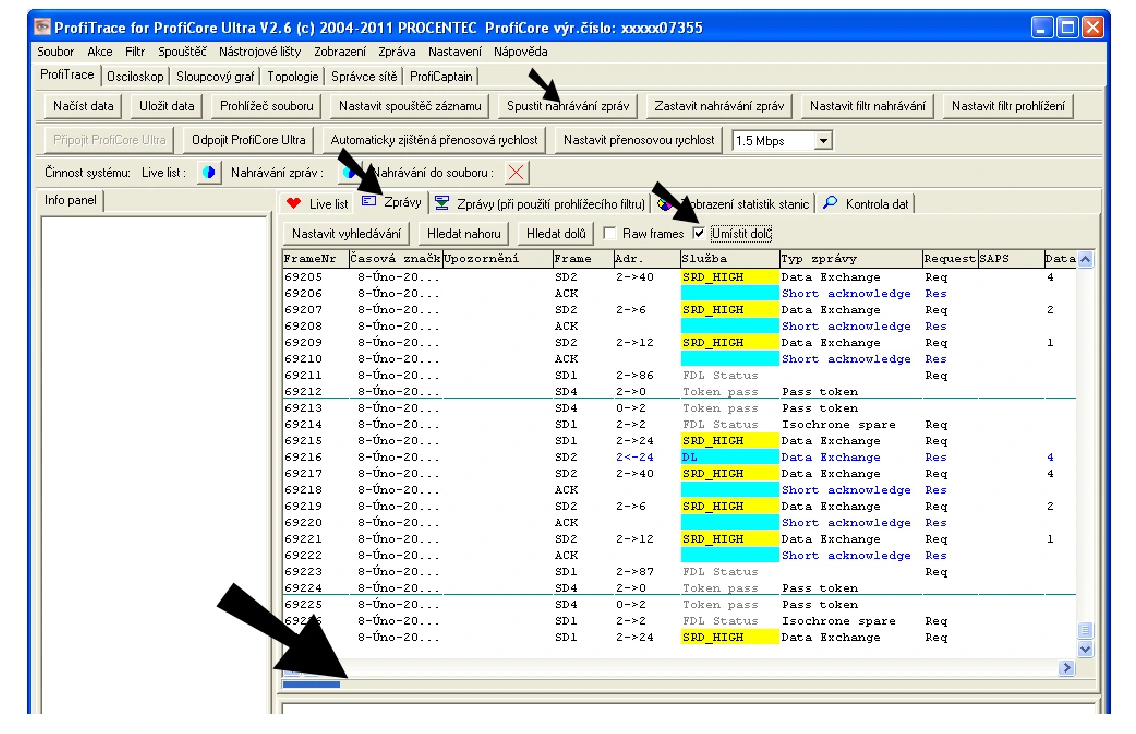
In the program version shown, the in-memory recording holds up to one million messages. The blue indicator at the bottom of the window shows its occupancy. Save the required data before starting another recording, as the previous recording may be overwritten.
For longer recordings, use Actions > Start Recording to File. Check the available options and limits in your installed version of the program.
Back to contentsTesters, training and measurement support
Choose a ProfiTrace kit for your network. If you need to practise interpreting waveforms and locating faults, visit the FOXON Academy training courses. We can also assist you with diagnostics directly on-site in the event of a specific fault.
Recommended products2
ProfiTrace 2 Ultra Pro – PROFIBUS DP/PA tester
5 944,73 EUR Incl. VAT

ProfiTrace 2 Ultra Plus – PROFIBUS DP Tester
4 399,56 EUR Incl. VAT